Researchers from France have developed a new technique that uses augmented reality (AR) images based on CT scans to improve visualization preoperatively and intraoperatively for shoulder replacement surgery, according to an article published online in Orthopaedics and Traumatology: Surgery and Research.
An increasing number of groups are reporting success using AR technology to facilitate surgery and interventional procedures, with the potential to boost overall efficiency. In the current feasibility study, first author Dr. Julien Berhouet from the University of Tours and colleagues proposed a method to improve shoulder arthroplasty for patients who have an injured glenoid, or shoulder joint, with the assistance of AR.
"AR technology was chosen as a potential tool for using the information generated before and during the surgical procedure," the authors wrote. "[An] advantage of AR is that it provides information directly, through its display on smart glasses, without additional transfer tools."
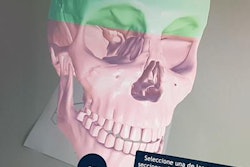
Their technique involved acquiring CT scans of an injured shoulder joint and applying predictive equations to estimate the position of any missing regions. This process allowed the researchers to reconstruct a 3D virtual model of the damaged shoulder bone and joint using open-source computer software (Blender). To make the model appear as realistic as possible, they also merged it with a separate 3D virtual model of a generic shoulder bone and joint.
After refining the final 3D model, Berhouet and colleagues used AR smart glasses (Moverio BT-200, Epson) to superimpose the model onto a setup display for simulating shoulder replacement surgery. Examining the 3D shoulder model with AR smart glasses enabled the surgeons to visualize parts of the surrounding anatomy that they would not be able to see using standard techniques, such as the more concealed areas of the scapula, or shoulder bone (Orthop Traumatol Surg Res, 3 December 2018).
In addition, the surgical team was able to refer to the 3D virtual models of the shoulder bones with AR when simulating reconstruction of the shoulder joint, which would be particularly useful for deciding the most appropriate type of implant needed and whether or not a patient would require an additional graft.
"The scapula information in itself could help a surgeon understand the orientation of the scapula and to position the glenoid instrumentation based on this information," the authors wrote.
"If the design of the available glenoid [implant] is not compatible with the patient's condition, 3D printing could be used to immediately make a customized implant," they noted.
Furthermore, clinicians could use AR technology to confirm the proper positioning of implants that were previously inserted with standard techniques, as well as bolster other kinds of joint surgery, the researchers noted.
"Information about the 'hidden' side of the acetabulum could be relevant during revision hip arthroplasty or tumor removal in the lesser pelvis," they wrote. "Other applications could be spine surgery and trauma surgery."