Australian researchers are using a CT-based technique to analyze blood flow of the coronary arteries in 3D and profile flow changes to predict heart disease, according to a study to be presented at this week's American Roentgen Ray Society (ARRS) meeting in Toronto.
Investigators from Curtin University in Perth used the technique, called computational fluid dynamics (CFD), to identify risk factors for the development and progression of coronary artery disease.
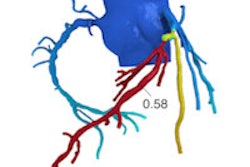
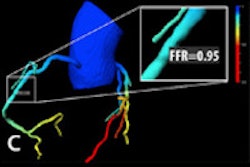
The group generated both idealized and realistic coronary models using CFD simulations of hemodynamic flow. The results showed a direct correlation between left coronary angulation and wall-shear stress changes, according to the researchers.
"Analysis of CFD complements cardiac CT imaging by being able to define internal biomechanics, including stresses and strain within the coronary artery system," said study co-author Zhonghua Sun, PhD, in a statement.
By combining cardiac CT imaging with qualitative and quantitative insights offered by computation, CT becomes a powerful risk assessment tool, he said.


![Overview of the study design. (A) The fully automated deep learning framework was developed to estimate body composition (BC) (defined as subcutaneous adipose tissue [SAT] in liters; visceral adipose tissue [VAT] in liters; skeletal muscle [SM] in liters; SM fat fraction [SMFF] as a percentage; and intramuscular adipose tissue [IMAT] in deciliters) from MRI. The fully automated framework comprised one model (model 1) to quantify different BC measures (SAT, VAT, SM, SMFF, and IMAT) as three-dimensional (3D) measures from whole-body MRI scans. The second model (model 2) was trained to identify standardized anatomic landmarks along the craniocaudal body axis (z coordinate field), which allowed for subdividing the whole-body measures into different subregions typically examined on clinical routine MRI scans (chest, abdomen, and pelvis). (B) BC was quantified from whole-body MRI in over 66,000 individuals from two large population-based cohort studies, the UK Biobank (UKB) (36,317 individuals) and the German National Cohort (NAKO) (30,291 individuals). Bar graphs show age distribution by sex and cohort. BMI = body mass index. (C) After the performance assessment of the fully automated framework, the change in BC measures, distributions, and profiles across age decades were investigated. Age-, sex-, and height-adjusted body composition reference curves were calculated and made publicly available in a web-based z-score calculator (https://circ-ml.github.io).](https://img.auntminnieeurope.com/mindful/smg/workspaces/default/uploads/2026/05/body-comp.XgAjTfPj1W.jpg?auto=format%2Ccompress&fit=crop&h=112&q=70&w=112)


