PET/CT with the radioisotope F-18 fluoroethylcholine (FEC) is a feasible and promising imaging alternative to FDG-PET/CT in detecting cervical and endometrial tumors, according to a pilot study from the U.K. presented last week at RSNA 2014.
While the results are encouraging, British researchers from the Imperial College London Cancer Research UK added that additional evaluation is now needed to assess FEC-PET/CT's staging accuracy.
Study co-author Dr. Tara Barwick, consulting radiologist at Imperial College London, told attendees that PET/CT with a choline radiotracer has been used widely in Europe for prostate cancer recurrence and in cases of high-risk staging. In the U.S., the Food and Drug Administration (FDA) in September 2012 cleared carbon-11-labeled choline imaging for recurrent prostate cancer imaging.
However, she added, the downside of carbon-11 choline is its short half-life of only 20 minutes. By comparison, fluoroethylcholine has a half-life of approximately 110 minutes, which allows for more widespread clinical use.
In addition, fluoroethylcholine-PET/CT is yet to be explored for gynecological malignancies.
"FEC-PET may provide prognostic information about the tumor and better nodal staging," Barwick said. "It is important to ensure at an early stage that there is some uptick in primary tumors on FEC-PET."
U.K. MAPPING study
Barwick and colleagues prospectively compared and evaluated the uptake of FEC in detecting known cervical and endometrial tumors in 15 patients recruited from the multicenter U.K. MAPPING study, which is designed to assess nodal involvement in surgically staged cervical and endometrial cancers.
Participants included six patients with endometrial cancer (stage 2 to 4B) and nine patients with cervical cancer (stages 1B1 to 2B). Four patients with squamous cervical tumors had their lesions removed by biopsy and subsequently removed from the study, leaving 11 individuals for the final analysis.
All patients underwent MRI, including diffusion-weighted imaging (DWI) MRI scans and FDG-PET/CT. FEC-PET/CT was offered as an optional study, but all patients chose to have the scan.


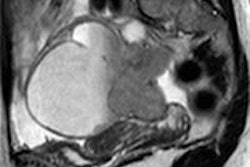
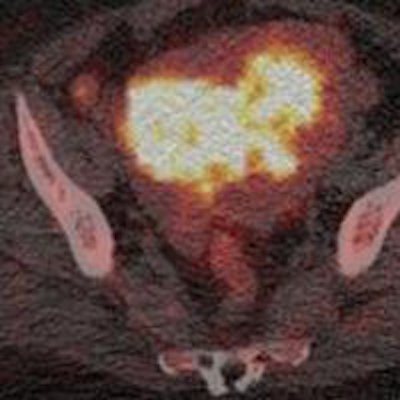
Images show a 29-year-old woman with stage IB grade 2 endometrioid adenocarcinoma filling the endometrial cavity (asterisks). There is intense uptake with FDG (26.2) and FEC (15.3). There is a lymph node (arrows), which shows on T2-weighted DWI (top row), as well as FDG-PET/CT (middle row) and FEC-PET/CT (bottom row). Images courtesy of Dr. Tara Barwick.
DWI was performed on a 1.5-tesla system with a torso phased-array coil. The FDG-PET/CT imaging protocol included a scan from the upper thighs to the skull base after four to six hours of fasting and FDG uptake of 60 minutes. The FEC-PET/CT exam was the same protocol as FDG-PET/CT and included the administration of 200 to 300 MBq of FEC.
Both FEC and FDG-PET/CT studies were performed on consecutive days. The time between DWI and the first PET/CT study was between 0 and 17 days, with a mean of six days.
Researchers then correlated information on tumor grade, primary tumor FDG maximum standardized uptake values (SUVmax), FEC SUVmax, and the apparent diffusion coefficient (ADC) mean for DWI. Histology was used as the reference standard.
One experienced reader interpreted both the FEC- and FDG-PET/CT images. Cervical and endometrial tumor volumes of interest were defined by segmentation of 40% SUVmax threshold. For DWI, primary cervical and endometrial tumors were segmented on the ADC map correlating with the T2-weighted and b = 1200 images at each slice where a tumor was present.
Image analysis
In reviewing the results, researchers noted there were no adverse effects following FEC administration. The primary tumor was visualized in 10 (91%) of the 11 cases on FEC-PET/CT and on all FDG-PET/CT (100%) and DWI (100%) studies.
Researchers speculated that the one tumor that was not detected above background activity on FEC was probably due to its small size and low-level avidity relative to FDG.
Among the 11 patients, the mean FEC SUVmax was 7.2 (± 3.8), which was significantly lower than the FDG SUVmax of 16.6 (± 10.7).
The difference in uptake between FEC in FDG, Barwick said, "relates to different aspects of tumor biology. There is no reason to expect the level of uptake [between FDG and FEC] to be the same. [FDG] is assessing glucose metabolism, and [FEC] is assessing cell membrane turnover."
The researchers found, however, positive correlation between FEC SUVmax and FDG SUVmax (r = 0.78), but no correlation between ADCmean and FEC or FDG SUVmax (r = -0.35 and -0.24, respectively).
When comparing high-grade (grade 3) tumors with low-grade (grade 1 and grade 2) tumors, the researchers found a significant difference in whole tumor ADCmean (p = 0.004), but no significant difference demonstrated in FEC SUVmax (p = 0.25) or FDG SUVmax (p = 0.28).
Barwick cited the small patient cohort as one limitation of the study.
"The trial now has recruited 56 patients in total, and further analysis will be possible when all site data becomes available," she added.
Barwick and her colleagues plan to continue their research by evaluating the prognostic value of combined PET and MRI functional data.
"Most tumors were detected on FEC," she noted. "It was important for us to establish an early stage for the MAPPING study. Further evaluation is now required to assess prognostic factors in staging accuracy."