A state-of-the-art 3D PET scanner can accurately image cerebral oxygen metabolism, as long as appropriate scatter compensation is carried out. In new work, researchers have demonstrated precisely how this can be achieved.
Oxygen-15 PET is the gold standard for quantitative assessment of oxygen uptake and metabolism in the brain. Predominantly a research tool where the tracer is typically inhaled, it is used to assess a range of disorders, and cerebrovascular disease in particular. However, gas in the breathing circuit and an individual's airways can degrade the images and the accuracy of quantitative data in 3D scans.
','dvPres', 'clsBtn', 'true' );" >

Click image to enlarge.
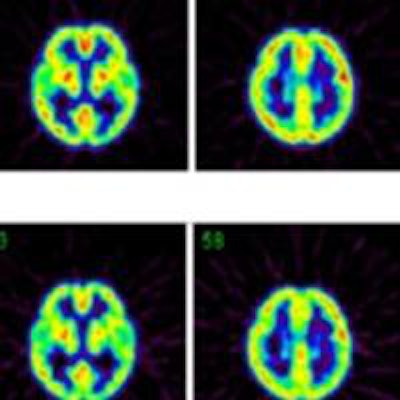
Top row: PET images from the head phantom. Middle row: PET images from the head phantom plus facemask, including out-of-FOV scatter correction. Bottom row: PET images from the phantom plus facemask, but with the out-of-FOV scatter compensation disabled. Arrows indicate the radioactivity in the face mask (a) and O-15 supply tube (b).
When data are acquired in 3D, radioactivity in the breathing circuit that delivers the O-15 labeled oxygen (O-15) and in the individual's trachea and lungs can present a challenge. Single photons emitted from these locations increase the occurrence of random events, where photons from separate annihilation events are misinterpreted as coming from a single annihilation in another location.
In turn, the random events can contribute to count loss through the dead time of the scanner. Photons scattered from the breathing circuit and airways can also be misinterpreted as coming from the brain, degrading the scan further.
Acquiring data in 2D avoids these phenomena, as the scanner's detectors are shielded from photons outside the imaged slice. However, 3D data acquisition is now standard and scanner manufacturers no longer support 2D acquisition. This motivated the researchers, led by Hidehiro Iida, PhD, director of investigative radiology at the National Cerebral and Cardiovascular Center Research Institute in Osaka, Japan, to investigate the performance of a 3D scanner, a Siemens Healthcare Biograph mCT. The study was performed in collaboration with Siemens Medical Systems (Physics in Medicine and Biology, September 2014, Vol. 59:18, pp. 5593-5609).
Testing scatter correction
In particular, the researchers investigated the performance of scatter correction techniques used in the scanner. The single scatter simulation (SSS) method corrects for scatter originating within the scanner's field-of-view (FOV) and a recent extension corrects for scatter from outside the FOV. The investigation included both phantom and in vivo scans. In the in vivo scans, a healthy volunteer inhaled O-15 gas and then O-15 labeled carbon dioxide, using a new protocol that simultaneously images the regional metabolic rate of oxygen and blood flow.
A head phantom containing fluorine-18 in the gray matter regions (to simulate the typical brain radioactivity following O-15 inhalation) provided a reference standard to test scanner performance, free of the scatter and random events produced by radioactivity in the facemask and breathing circuit.
In two other scans, a facemask containing O-15 was added to the phantom. In one, the facemask was positioned inside the FOV while in the other it was positioned partially outside. In a further scan, a cylindrical phantom filled with fluorine-18 was placed next to the head phantom to simulate the effect of radioactivity in the lungs.
Using the core SSS scatter correction, when the facemask was included in the scan inside the scanner's FOV, counts in the head phantom deviated from the reference scan by less than ± 2%. When the lung phantom was placed on the scanner couch, the error increased slightly to 3%. Positioning the facemask partially outside the FOV, where the SSS technique could not correct for scatter increased errors to 2% to 6%.
When the out-of-FOV scatter correction was included, however, errors increased significantly, with the scanner underestimating counts from the brain phantom in all experiments. For example, when the facemask was partially outside the FOV, counts were underestimated by 2% to 19%.
 Maximum intensity projections from a brain scan of a healthy volunteer during O-15 inhalation, without (top row) and with (bottom row) out-of-FOV scatter correction.
In the scan of the healthy volunteer, the authors reported good image quality when the SSS technique was applied. Again though, introduction of the out-of-FOV correction degraded the images, resulting in inaccurate reconstruction of counts from the carotid arteries and parts of the brain's cerebellum and temporal lobe.
Based on their findings, the researchers conclude that a state-of-the-art 3D PET scanner can be used to accurately image cerebral oxygen metabolism. Scatter is adequately compensated using the SSS technique if the face mask and patient's trachea are inside the scanner's FOV, and this can be achieved with a large FOV in the axial direction.
© IOP Publishing Limited. Republished with permission from medicalphysicsweb, a community website covering fundamental research and emerging technologies in medical imaging and radiation therapy.