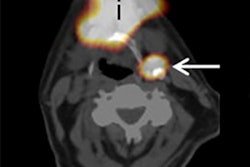
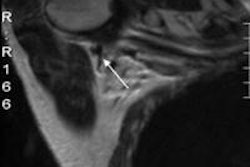
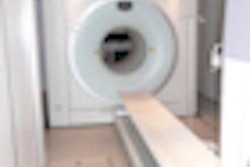
Presurgical SPECT/CT provides more effective sentinel node imaging than lymphoscintigraphy, according to results from an international multicenter trial presented at the Society of Nuclear Medicine and Molecular Imaging (SNMMI) annual meeting.
SPECT/CT found significantly more sentinel lymph-node involvement, the researchers reported. This outcome remained over a range of cancers, including melanoma, breast carcinoma, and malignancies of the pelvis such as prostate and cervical cancer.
| No. of cancerous sentinel nodes detected | |||
| Cancer type | Planar lymphoscintigraphy | SPECT/CT | Improvement |
| Pelvic cancer | 138 | 195 | 29.2% |
| Breast cancer | 1,892 | 2,165 | 13% |
| Melanoma | 532 | 602 | 11.5% |
SPECT/CT also led to substantial changes in surgical planning due to the detection of additional sentinel nodes:
- 64.1% of pelvic cancer surgeries changed.
- 37% of melanoma surgeries changed.
- 16.9% of breast cancer surgeries changed.
The two imaging systems had a mismatch between sentinel nodes and lymphatic territories of 17% for breast cancer, 11.2% for melanoma, and 50% for pelvic imaging. The significantly higher mismatch in pelvic tumors may be due to relatively deeper lymphatic drainage and location of pelvic sentinel nodes, according to the researchers.
The study results could potentially inform new clinical practice and shape appropriate use of SPECT/CT imaging for patients selected for surgery, said co-author Dr. Thomas Pascual, of the International Atomic Energy Agency, in a statement.


![Overview of the study design. (A) The fully automated deep learning framework was developed to estimate body composition (BC) (defined as subcutaneous adipose tissue [SAT] in liters; visceral adipose tissue [VAT] in liters; skeletal muscle [SM] in liters; SM fat fraction [SMFF] as a percentage; and intramuscular adipose tissue [IMAT] in deciliters) from MRI. The fully automated framework comprised one model (model 1) to quantify different BC measures (SAT, VAT, SM, SMFF, and IMAT) as three-dimensional (3D) measures from whole-body MRI scans. The second model (model 2) was trained to identify standardized anatomic landmarks along the craniocaudal body axis (z coordinate field), which allowed for subdividing the whole-body measures into different subregions typically examined on clinical routine MRI scans (chest, abdomen, and pelvis). (B) BC was quantified from whole-body MRI in over 66,000 individuals from two large population-based cohort studies, the UK Biobank (UKB) (36,317 individuals) and the German National Cohort (NAKO) (30,291 individuals). Bar graphs show age distribution by sex and cohort. BMI = body mass index. (C) After the performance assessment of the fully automated framework, the change in BC measures, distributions, and profiles across age decades were investigated. Age-, sex-, and height-adjusted body composition reference curves were calculated and made publicly available in a web-based z-score calculator (https://circ-ml.github.io).](https://img.auntminnieeurope.com/mindful/smg/workspaces/default/uploads/2026/05/body-comp.XgAjTfPj1W.jpg?auto=format%2Ccompress&fit=crop&h=112&q=70&w=112)


