Thanks mostly to its ability to improve specificity, computer-aided diagnosis (CADx) software can bolster characterization of focal prostate lesions on multiparametric MRI scans, French researchers reported in the June issue of Radiology.
A team led by Emilie Niaf, PhD, of the Université de Lyon found that CADx helped both experienced and less-experienced observers improve their performance in characterizing benign prostate lesions found on multiparametric MRI in the peripheral zone.
"This better recognition of benign lesions may be particularly helpful in avoiding unnecessary prostate biopsies or in selecting patients for focal therapy," the authors wrote.
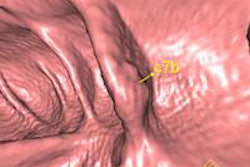
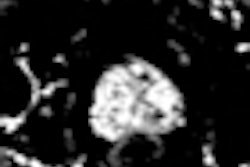
Multiparametric MRI -- the combination of T2-weighted imaging with diffusion-weighted or dynamic contrast-enhanced imaging, and/or MR spectroscopy -- has shown promising results for detecting prostate cancer. But it can be difficult for less-experienced readers to characterize focal prostate lesions on these studies, especially when individual MR sequences offer conflicting findings, according to the researchers.
Improving characterization
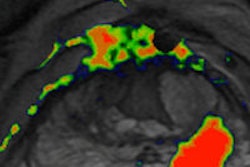
After developing a CADx algorithm that assesses the likelihood of malignancy on these multiparametric MR studies, the group sought to assess its ability to improve characterization of focal prostate lesions by readers of varying levels of experience (Radiology, June 2014, Vol. 271:3, pp. 761-769). In a retrospective review of 30 consecutive 1.5-tesla multiparametric MR exams obtained before radical prostatectomy in patients between September 2008 and February 2010, 12 readers were asked to assess the likelihood of malignancy of 88 predefined peripheral-zone lesions over three reading sessions.
The 12 readers included six residents at the end of their six-month rotations in urogenital radiology, and a senior radiologist with no experience in prostate multiparametric MRI, as well as five senior urogenital radiologists with one to seven years of prostate imaging experience. Prior to the study, the seven less-experienced readers were given a refresher course on the characterization of focal lesions at multiparametric MRI. In addition, all readers were informed of the principles, advantages, and limitations of the CADx software, as well as the receiver operating characteristic (ROC) curve obtained with the standalone system, according to the authors.
Likelihood of malignancy was assessed using a subjective score of 0 (definitely benign) to 4 (definitely malignant) in an initial reading session and in a repeat reading session conducted five weeks later. After they received CADx results, the readers could then amend the score they had assigned during the second reading session. The researchers then performed ROC analysis to assess diagnostic accuracy, as determined by the mean area under the curve (AUC).
| Reader accuracy by session | |||
| Mean AUC for Session 1 | Mean AUC for Session 2 | Mean AUC for Session 3 (after CADx) | |
| Less-experienced readers | 80.3% | 81.9% | 85.6% |
| Experienced readers | 83% | 84.1% | 87.2% |
While the less-experienced readers had significantly lower mean AUCs than the experienced readers in each reading session, the improvements in mean AUC after viewing CADx results did not reach statistical significance for either group (p = 0.08 and p = 0.16, respectively).
Improved specificity
However, the probabilities of assigning a subjective score of 2 or 3 to lesions that were benign did drop significantly for both groups of readers after receiving the CADx results.
Overall specificity for a positivity threshold of 3 (the sum of probabilities of assigning a score of 0, 1, or 2):
- Reading session 1: 78.7%
- Reading session 2: 79%
- Reading session 3: 86.2%
The improvement between sessions 2 and 3 was statistically significant (p < 0.03) and did not come with a reduction in sensitivity, according to the researchers.
"Indeed, the overall sensitivity constantly increased between reading sessions 1 and 3," they wrote. "More scores of 4 and fewer indeterminate scores (subjective score = 2) were assigned to malignant lesions with CAD assistance."
The results suggest that the main benefit of the CADx system is to improve the correct classification of benign lesions, a potentially useful advantage because up to 75% of focal lesions seen at multiparametric MRI are benign and the false-positive rate can reach 40% even for experienced observers, according to the team.
"Recognizing a portion of these false-positives as formally benign could avoid unnecessary biopsy when multiparametric MR imaging is used as a triage test or improve patient selection for focal therapy," they wrote.
The researchers acknowledged that further research is necessary to define how CADx systems could be used during daily routine.