Due to the movable nature of the breast, presurgery image correlation is particularly problematic and remains essential to get right, Dr. Debra Ikeda, professor of radiology and director of breast imaging at Stanford University in California, told delegates at the recent Symposium on State-of-the-Art Imaging (iSi 2011) in Bordeaux, France.
Speaking about correlating breast images from different modalities, she explained that after a positive MRI, what the radiologist sees on second-look ultrasound may be a decisive factor in locating cancers. Doctors should use their knowledge of modality limitations and disease morphology to spot subtle findings. Specifically, radiologists should review what cancers such as ductal carcinoma in situ (DCIS) look like on second-look ultrasound and understand methods for needle localization so that surgeons can cleanly remove lesions. Studies show that in approximately one out of every eight second-look ultrasound-guided biopsies, doctors did not biopsy the same lesion seen in the original exam, she noted.
"For a lumpectomy, it is even more important that what you are targeting has been accurately marked for the surgeon. The last thing a surgeon wants to do is miss cancer," said Ikeda, who outlined how procedures at Stanford have been improved. (See boxes below text in this article.)
Carefully looking at the breast tissue around the cancer is a key means of localization, and this also poses challenges.
"When a patient lies down for ultrasound after a positive MRI or mammography, the mass will move closer to the chest wall," she explained. "To figure out where the tumor will be when the patient lies down, you want to look at the skin, fat, and white glandular tissue. The tumor should be within the breast tissue but, crucially, closer to the chest wall."
In addition to knowing how the patient's position changes where the mass appears in an image, the sensitivity and specificity of each test must be in the radiologists' repertoire of facts, such as cancers that might not be visible in second-look ultrasound.
"Ultrasound finds lesions 70% of the time after a positive breast MRI, and of these, 30% will be cancer. It won't find lesions in 20% to 30% of cases after breast MRI, and in 15% of these there will be undetected cancers," Ikeda commented. "So if you do an MRI and it looks really bad, you need to biopsy it because sometimes you won't see the finding on ultrasound."
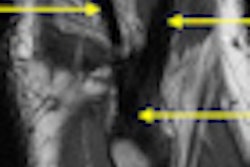
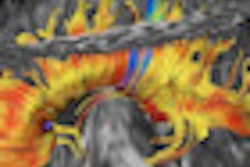
Knowledge of tumor morphology can prove valuable. The "stacked duct" sign of DCIS, when the patient is supine on ultrasound, may be more visible than microcalcifications. In comparison, the stacked appearance on ultrasound is replaced by the clumped enhancement of enlarged ducts, or "string of pearls" pattern in MRI.
"If you know the anatomy and pathology of the DCIS, you can predict what it will look like in all modalities," Ikeda said.
For other lesions, the "taller than wide" sign, particularly when the mass grows through the benign honeycomb-shaped Cooper's ligaments rather than between them, is also indicative of malignancy. However, radiologists must remember that when correlating a mass that has crossed normal tissue planes visualized in ultrasound, the taller than wide sign will be at different angles in the varied MRI planes, she noted.
In addition, an updated second edition of the BI-RADS MRI lexicon, due out in November of this year, will also help radiologists clearly describe what they see in images.
"Care should be taken over correlating MRI, ultrasound, and mammography, and your reports need to be clear," Ikeda concluded. "Use your eyes and your brain. These are the most important tools for correlating findings and locating cancer."
We were not clear in our reports at Stanford
|
Stanford reports
|
Number the breast lesions
|