
Dear MRI Insider,
So-called "mad cow disease" and other variants of Creutzfeldt-Jakob disease (CJD) can be particularly difficult to diagnose, but advances in MRI are helping to make the task easier. In some cases, the modality can lead to a correct diagnosis, even when the clinical information, electroencephalography, and cerebrospinal fluid analysis data are uncertain.
Italian researchers believe every radiologist has a duty to know more about the MRI findings and characteristics of CJD. In an award-winning e-poster at RSNA 2012 in Chicago, they had some practical tips and useful information on this subject. To read more, go to our MRI Digital Community, or click here.
Sir Peter Mansfield, joint winner of the 2003 Nobel Prize in physiology or medicine for his contributions to MRI, has published his new autobiography, The Long Road to Stockholm. The Maverinck has reviewed it in his last column and he's not impressed by the style and contents of the book. Get the story here.
Increasing numbers of women with ruptured breast implants are presenting in imaging departments, and MRI is proving really useful in these cases. Radiologists from a top London teaching hospital have some advice and suggestions in this area. Click here to learn more.
Meanwhile, German researchers have found that MRI screening can help detect breast cancer in women who are only at average risk of developing the disease and have no personal or family history of breast cancer. Find out more by clicking here.
This is only a brief selection of the many articles posted in the MRI Digital Community. Make sure you check out the rest of them.

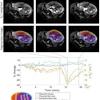
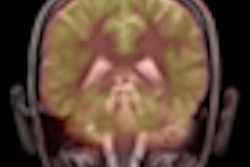
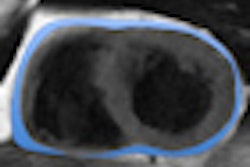
![Overview of the study design. (A) The fully automated deep learning framework was developed to estimate body composition (BC) (defined as subcutaneous adipose tissue [SAT] in liters; visceral adipose tissue [VAT] in liters; skeletal muscle [SM] in liters; SM fat fraction [SMFF] as a percentage; and intramuscular adipose tissue [IMAT] in deciliters) from MRI. The fully automated framework comprised one model (model 1) to quantify different BC measures (SAT, VAT, SM, SMFF, and IMAT) as three-dimensional (3D) measures from whole-body MRI scans. The second model (model 2) was trained to identify standardized anatomic landmarks along the craniocaudal body axis (z coordinate field), which allowed for subdividing the whole-body measures into different subregions typically examined on clinical routine MRI scans (chest, abdomen, and pelvis). (B) BC was quantified from whole-body MRI in over 66,000 individuals from two large population-based cohort studies, the UK Biobank (UKB) (36,317 individuals) and the German National Cohort (NAKO) (30,291 individuals). Bar graphs show age distribution by sex and cohort. BMI = body mass index. (C) After the performance assessment of the fully automated framework, the change in BC measures, distributions, and profiles across age decades were investigated. Age-, sex-, and height-adjusted body composition reference curves were calculated and made publicly available in a web-based z-score calculator (https://circ-ml.github.io).](https://img.auntminnieeurope.com/mindful/smg/workspaces/default/uploads/2026/05/body-comp.XgAjTfPj1W.jpg?auto=format%2Ccompress&fit=crop&h=100&q=70&w=100)


![Overview of the study design. (A) The fully automated deep learning framework was developed to estimate body composition (BC) (defined as subcutaneous adipose tissue [SAT] in liters; visceral adipose tissue [VAT] in liters; skeletal muscle [SM] in liters; SM fat fraction [SMFF] as a percentage; and intramuscular adipose tissue [IMAT] in deciliters) from MRI. The fully automated framework comprised one model (model 1) to quantify different BC measures (SAT, VAT, SM, SMFF, and IMAT) as three-dimensional (3D) measures from whole-body MRI scans. The second model (model 2) was trained to identify standardized anatomic landmarks along the craniocaudal body axis (z coordinate field), which allowed for subdividing the whole-body measures into different subregions typically examined on clinical routine MRI scans (chest, abdomen, and pelvis). (B) BC was quantified from whole-body MRI in over 66,000 individuals from two large population-based cohort studies, the UK Biobank (UKB) (36,317 individuals) and the German National Cohort (NAKO) (30,291 individuals). Bar graphs show age distribution by sex and cohort. BMI = body mass index. (C) After the performance assessment of the fully automated framework, the change in BC measures, distributions, and profiles across age decades were investigated. Age-, sex-, and height-adjusted body composition reference curves were calculated and made publicly available in a web-based z-score calculator (https://circ-ml.github.io).](https://img.auntminnieeurope.com/mindful/smg/workspaces/default/uploads/2026/05/body-comp.XgAjTfPj1W.jpg?auto=format%2Ccompress&dpr=2&fit=crop&h=167&q=70&w=250)


