Dear MRI Insider,
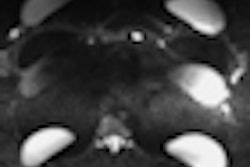
MRI at a 3-tesla field strength can help monitor patients receiving radiofrequency (RF) ablation therapy for liver lesions, according an article we're featuring in this edition of the MRI Insider.
Swiss researchers found that the 3-tesla technique, with specialized scanning protocols like diffusion-weighted imaging (DWI), can help clinicians track changes in tumor response to RF ablation, thanks to a "clear and predictable pattern" of apparent diffusion coefficient (ADC) values. Learn more by clicking here.
In other news, 3-tesla scanning was also used by U.K. researchers in their study on a 3D whole-heart myocardial perfusion protocol that they think could make MRI more competitive with traditional techniques for myocardial perfusion imaging like SPECT. Find out how the protocol is better than 1.5-tesla scanning by clicking here.
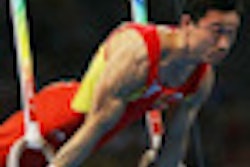
The opening ceremony of the 2012 Olympic Games is tonight, and where better than your MRI Digital Community to learn how imaging is being used at the Olympic polyclinic to treat athletes. Learn what imaging technology they'll have at their fingertips by clicking here.
Other articles we're featuring in this edition of the Insider include:
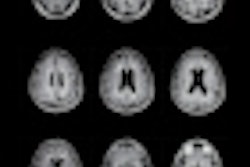
- A study by Swiss researchers on how they used MRI to track the effectiveness of the drug fingolimod for patients with multiple sclerosis
- How MRI could offer a solution to imaging women with silicone breast implants, an important consideration in the wake of the Poly Implant Prosthèse (PIP) scandal
- How adding a contrast agent based on ultrasmall superparamagnetic iron oxide particles to standard gadolinium contrast exams could provide a better way of scanning patients with multiple sclerosis


![Overview of the study design. (A) The fully automated deep learning framework was developed to estimate body composition (BC) (defined as subcutaneous adipose tissue [SAT] in liters; visceral adipose tissue [VAT] in liters; skeletal muscle [SM] in liters; SM fat fraction [SMFF] as a percentage; and intramuscular adipose tissue [IMAT] in deciliters) from MRI. The fully automated framework comprised one model (model 1) to quantify different BC measures (SAT, VAT, SM, SMFF, and IMAT) as three-dimensional (3D) measures from whole-body MRI scans. The second model (model 2) was trained to identify standardized anatomic landmarks along the craniocaudal body axis (z coordinate field), which allowed for subdividing the whole-body measures into different subregions typically examined on clinical routine MRI scans (chest, abdomen, and pelvis). (B) BC was quantified from whole-body MRI in over 66,000 individuals from two large population-based cohort studies, the UK Biobank (UKB) (36,317 individuals) and the German National Cohort (NAKO) (30,291 individuals). Bar graphs show age distribution by sex and cohort. BMI = body mass index. (C) After the performance assessment of the fully automated framework, the change in BC measures, distributions, and profiles across age decades were investigated. Age-, sex-, and height-adjusted body composition reference curves were calculated and made publicly available in a web-based z-score calculator (https://circ-ml.github.io).](https://img.auntminnieeurope.com/mindful/smg/workspaces/default/uploads/2026/05/body-comp.XgAjTfPj1W.jpg?auto=format%2Ccompress&fit=crop&h=100&q=70&w=100)


![Overview of the study design. (A) The fully automated deep learning framework was developed to estimate body composition (BC) (defined as subcutaneous adipose tissue [SAT] in liters; visceral adipose tissue [VAT] in liters; skeletal muscle [SM] in liters; SM fat fraction [SMFF] as a percentage; and intramuscular adipose tissue [IMAT] in deciliters) from MRI. The fully automated framework comprised one model (model 1) to quantify different BC measures (SAT, VAT, SM, SMFF, and IMAT) as three-dimensional (3D) measures from whole-body MRI scans. The second model (model 2) was trained to identify standardized anatomic landmarks along the craniocaudal body axis (z coordinate field), which allowed for subdividing the whole-body measures into different subregions typically examined on clinical routine MRI scans (chest, abdomen, and pelvis). (B) BC was quantified from whole-body MRI in over 66,000 individuals from two large population-based cohort studies, the UK Biobank (UKB) (36,317 individuals) and the German National Cohort (NAKO) (30,291 individuals). Bar graphs show age distribution by sex and cohort. BMI = body mass index. (C) After the performance assessment of the fully automated framework, the change in BC measures, distributions, and profiles across age decades were investigated. Age-, sex-, and height-adjusted body composition reference curves were calculated and made publicly available in a web-based z-score calculator (https://circ-ml.github.io).](https://img.auntminnieeurope.com/mindful/smg/workspaces/default/uploads/2026/05/body-comp.XgAjTfPj1W.jpg?auto=format%2Ccompress&fit=crop&h=112&q=70&w=112)


