French and German researchers scooped the top prizes in the "Images in Radiology" collection. The winner was a cinematic 3D-rendered image of a woman with Marfan syndrome, while the runner up was given for MRI scans of a 15-year-old boy with myocarditis after COVID-19 vaccination.
The top images were selected by the Radiology in Training editorial board based on aggregate scores from individual editorial board members' rankings, according to the journal. The images were selected based on three criteria: novel technology or unusual pathology, educational or thought-provoking, and visually compelling.
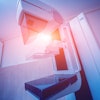
The 2022 winner was from an article published on 14 June 2022, titled, "Intradural Small Bowel Herniation." by neuroradiologists at the Francois Mitterrand University Hospital in Dijon, France. The cinematic 3D-rendered image depicts unusual pathology in a case of a 38-year-old woman with Marfan syndrome who underwent resection for a presumed right ovarian cyst.
 Images of a 38-year-old woman with Marfan syndrome who was diagnosed with intradural small bowel herniation through a torn right S1 dural ectasia. (A) Oblique global illumination rendering of abdominal CT scan after semiautomatic segmentation of the enlarged afferent small bowel (*). The hernia orifice (arrowheads) separates the peritoneal cavity and the intradural space. (B, C) T2-weighted MRI scans in (B) axial and (C) sagittal planes show the herniated loop (arrowheads in B) of small bowel (* in B) ascending at L5-S1 (arrows), causing significant compression of the adjacent cauda equina nerve roots. All figures courtesy of Radiology.
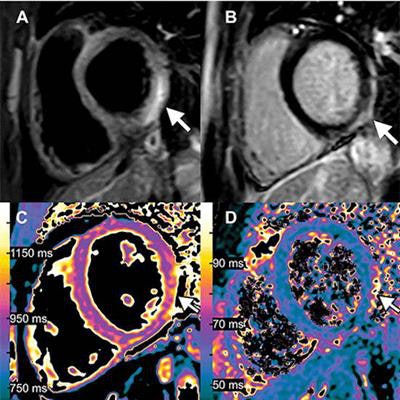
The first runner-up is an article published on 3 August 2021, titled, "Myocarditis Following COVID-19 Vaccination," by a group at University Hospital Bonn, Germany. This is the third consecutive year in which a COVID-related image was honored among top contenders.
 Images of a 15-year-old boy with myocarditis after COVID-19 vaccination. One day after receiving his second vaccination dose, he developed fever, myalgia, and intermittent tachycardia. (A) T2-weighted short inversion time inversion recovery MRI scan at 1.5 T in short-axis view shows focal high-signal intensities (arrow) at basal lateral and inferior wall, indicating myocardial edema. (B) Late gadolinium enhancement image in short-axis view shows corresponding linear subepicardial enhancement (arrow), indicating inflammatory myocardial necrosis. (C) T1 mapping and (D) T2 mapping in short-axis view show elevated T1 and T2 at the midventricular lateral and inferolateral wall (arrow in C and D), indicating acute myocardial injury (focal T1, 1165 msec; focal T2, 70 msec; institution-specific cutoff values for acute myocarditis: T1 global ≥1000 msec, T2 global ≥55.9 msec).
The second runner-up was a tie between two articles. The first, "CT of Ongoing Intracerebral Hemorrhage," is by a group at the People's Hospital of Deyang City in Sichuan, China. The image captured the rapid evolution of a progressively expanding intracerebral hemorrhage in a 73-year-old man.
 Images of a 73-year-old man with acute left-sided weakness. (A) Axial noncontrast CT image of the head shows no intracerebral hemorrhage. (B) Arterial phase CT angiogram obtained 192 seconds later, after administration of contrast material, demonstrates focal enhancement in the left basal ganglia (arrow). (C, D) CT angiograms obtained in the (C) second and (D) third phases, with delays of 39 seconds and 38 seconds, respectively, highlight the active expansion of the intracerebral hemorrhage with the blood-contrast level (arrows). (E) Coronal maximum intensity projection image reveals that the bleeding was located near the distal ends of the lenticulostriate arteries (arrow). (F) Follow-up noncontrast CT image obtained 1 hour after the third phase CT angiogram shows massive enlargement of the hematoma, intraventricular hemorrhage, hydrocephalus, and subfalcine herniation.
All three images exemplify the significant contributions made by radiology to the field of medicine and were selected from 43 images published between 2 July 2021 and 30 June 2022, up from 29 in 2021, the journal said.
All images were published in open-access articles, with the full article announcing the winners available on the journal's website.