Is magnetic field strength a limit to MR image quality? Not when new approaches are implemented, according to the influential MRI researcher Dr. Graeme Bydder.
"The high-field, low-field argument is usually couched in terms of signal-to-noise ratio, but we can shift the emphasis to contrast-to-noise ratio and this provides new options for further development," he told attendees recently at the European Society of Magnetic Resonance in Medicine and Biology (ESMRMB) virtual meeting.
Bydder, professor emeritus of radiology at the University of California, San Diego, gave a tour through the past and present of low-field MR imaging during a plenary session held on 7 October discussing the low and high extremes of the MRI field spectrum.
 1.5T: General Electric normal subject T1-wSE. Paul Bottomley's lab notebook and images (February 1983). The high-field (1.5-tesla) results were "totally unexpected," Bydder said. Image courtesy of MRIS History UK.
In the early 1980s, "field wars" kicked off in the world of MRI. Paul Bottomley, PhD, produced very high-quality brain images on a General Electric 1.5-tesla lab prototype in February 1983. The field strength was ten times greater than what most researchers were using at the time.
In response, and in order to stay in business, lower-field companies and imagers developed new advances to narrow the gap with GE and so sell their systems, Bydder said. The advances included local receiver coils, low-bandwidth acquisitions, STIR pulse sequences, heavily T2-weighted gradient-echo sequences for susceptibility-weighted imaging, as well as motion artifact control techniques (e.g., Respiratory Ordered Phase Encoding, ROPE), and use of the novel contrast agent gadolinium-DTPA.
"Many of the technical advances first made at low-field were subsequently implemented at high-field imaging, where they often performed as well or better than at low-field, and the advantage for low-field was lost," Bydder said.
Yet progress in low-field MRI didn't screech to a halt and today improvements are being made using the concepts of tissue property filters (TP-filters) derived from Bloch equations and synergistic contrast MRI (scMRI).
In scMRI, a single tissue property, such as T1 or T2, is used twice in the same sequence to increase contrast, or two or more tissue properties are used in the same sequence for the same purpose, Bydder said. The TP-filters approach treats pulse sequences as filters of tissue properties and shows them in graphical form.
 T1 filters for the subtracted inversion recovery (SIR) sequence. Plots of signal against T1. A short TI (red) filter has subtracted from it a longer TI filter (green) to produce the subtraction filter (blue). The slope of the blue filter in the central region is nearly twice that of either of the two contributing filters. A small increase in T1 (horizontal green arrow) is multiplied by the steep slope of the blue filter (red line) to produce very high positive contrast (vertical blue arrow). Image courtesy Ian Young, Nikolaus Szeverenyi, et al and Quantitative Imaging in Medicine and Surgery.
In this example, Bydder explained the T1 TP-filter for the inversion recovery (IR) sequence plots signal against T1 and is notch-shaped. One of these is shown for a short inversion time (TI) filter (red curve) and another for a longer TI filter (green curve) in the graph.
The subtraction filter (first filter minus second filter) is the blue curve which shows a steeply positive sloping central region. A small increase in T1 (the horizontal green arrow) in this region multiplied by the high positive slope of the subtraction filter (red line) results in high positive contrast (vertical blue arrow).
The TP-filter model provides a mathematical framework for converting conventional qualitative univariate weighting as used in everyday clinical practice into quantitative univariate weighting.
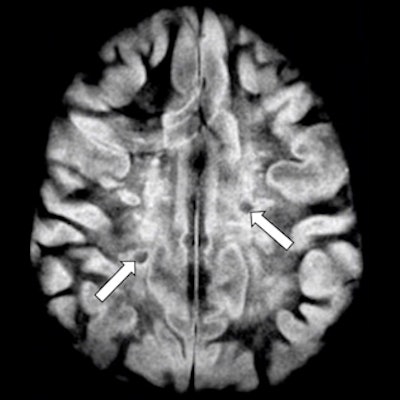
 Transverse image of the brain in a case of multiple sclerosis T2 spin-echo (SE) (A) and subtracted inversion recovery (SIR) (B) images. Very long T1 high signal lesions are seen in (A) and show intermediate signal in (B) (arrows). Other lesions appear much more extensive in (B) where abnormalities extend towards the peripheral U fibers in most of the white matter. Image courtesy of Ya-Jun Ma, Hongda Shao, et al and Quantitative Imaging in Medicine and Surgery.
For instance, the effect of this subtracted inversion recovery (SIR) sequence can be seen in a patient with multiple sclerosis (above) where focal lesions appear in the white matter with a T2-weighted spin-echo sequence, while much more extensive changes are seen throughout most of the brain with the SIR sequence.
"The increase in T1 produced by the lesions is used synergistically by each of the two parts of the SIR sequence to increase contrast," Bydder said.
The same principle can be applied to different tissue properties, and this provides an array of new MASTIR (multiplied, added, subtracted and/or fitted IR) sequences, including the SIR sequence. MASTIR sequences are very sensitive to small changes in tissue properties both separately and together when changes occur concurrently, which is often the case in disease, he explained.
MASTIR sequences can also be used to increase image specificity by direct imaging of myelin using double echo sliding inversion recovery (DESIRE) and short TR adiabatic IR (STAIR) sequences. The basic components of MASTIR sequences are available on many commercial MR systems.
"As a result, the technical entry cost to implement most of the prototype forms of these sequences is low," Bydder concluded.