CT could potentially become an important player in the emerging field of structural bone assessment -- an advanced osteoporosis test that outperforms bone mineral density analysis for gauging the strength and structural integrity of bones.
Researchers from Berlin and San Francisco believe the modality is capable of evaluating trabecular structures from the extremities to the vertebrae, outperforming even high-resolution peripheral quantitative CT (HR-pQCT) in some conditions.
But don't look for the bone-structure-analysis storefront at your local strip mall just yet. Before CT-based evaluation becomes practical in the clinical setting, a raft of studies will be needed to standardize techniques and determine normal values and ranges.
In studies unveiled at the 2009 European Congress of Radiology (ECR) in Vienna, researchers from Charité Medical University in Berlin and the University of California, San Francisco (UCSF) compared 64- and 320-detector-row MDCT to each other, to standard bone mineral density tests, and to HR-pQCT, the current gold standard modality for structural bone assessment.
 |
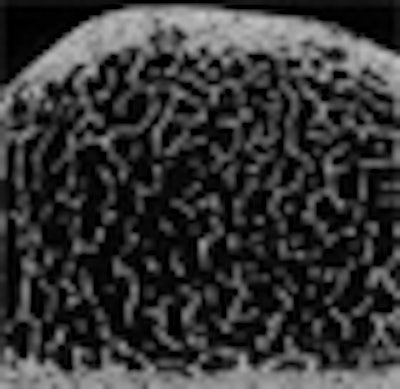
| Trabecular structure of the human radius bone at micro-CT, 18-µm spatial resolution. Image courtesy of Dr. Ahi Sema Issever and Dr. Patrick Rogalla. |
Osteoporosis, a systemic skeletal disease characterized by low bone mass and structural deterioration that increases susceptibility to fractures, affects more than 10 million older adults (80% women) in the U.S., with treatment costs that are expected to grow exponentially as the population ages.
Unfortunately, the disease often goes undiagnosed until a costly, debilitating fracture occurs, in part because screening rates with two available bone mineral density screening methods, dual-energy x-ray absorptiometry (DEXA) and quantitative CT (QCT), are low among older patients at risk. Second, the assessment of bone mineral density is a poor measure of bone strength.
"The current approach is by assessment of ... bone mineral density using DEXA or QCT, establishing two scores which would ideally identify patients who have normal T-scores [a bone mineral density measure that compares the subject's score to that of a healthy 30-year-old and to subjects of comparable age and sex] and will ideally identify patients at risk of fracture when they have an osteoporotic T-score," said Dr. Ahi Sema Issever, a Charité radiology resident and researcher in residence at UCSF. "But the reality is very different. Multiple studies have shown that bone mineral density alone is not a sufficient discriminator of bone strength."
For this reason, researchers have long looked to the latticelike trabecular structure of bone as a better tool to gauge bone strength and changes in bone quality. HR-pQCT, with a resolution of 82 microns, is the current gold standard for in vivo structural imaging, Issever said. Her group has also worked with both MDCT and MRI for this purpose, both of which offer lower resolution than HR-pQCT, to determine how well they characterize the trabecular structure and perform a structural analysis, she said.
64- versus 320-detector-row CT
The first study Issever presented sought to "look in more detail at MDCT and compare different scanner types, 64-slice [Aquilion 64, Toshiba America Medical Systems, Tustin, CA] and 320-slice [Aquilion One, Toshiba] compared to HR-pQCT-derived protocols," she said.
Issever and her colleagues, including Dr. Thomas Link, Dr. Marie Kenentich, Dr. Patrick Rogalla, and Dr. Bernd Hamm, examined 20 human cadaver distal forearm specimens, using a scan protocol of 120 kV and 100 mAs for 64-detector-row CT and 135 kV and 400 mAs for the 320-detector-row scanner, with slice increments of 300 and 250 μm, respectively. On both scanners, the in-plane resolution was 234 μm and the slice thickness was 500 μm. HR-pQCT imaging at an isotropic voxel size of 41 μm served as the standard of reference.
"This [41 μm] is a higher resolution than is normally used with the HR-pQCT system, but we really wanted to get close to the trabecular structure," she said.
Trabecular structure measures including bone volume fraction (BV/TV), trabecular number (Tb.N.), trabecular thickness (Tb.Th.), and trabecular spacing (Tb.Sp.) were computed and compared to each other.
A comparison of structural parameters with the two CT systems versus HR-pQCT-derived norms showed no advantage with the use of 320-dectector-row CT compared to 64-detector-row CT.
Structural parameters with both MDCT models were highly correlated with corresponding HR-pQCT parameters for bone volume fraction and trabecular spacing (BV/TV and Tb.Sp.; range, r = 0.92-0.96; p < 0.0001).
Correlations were weaker for trabecular numbers, nevertheless reaching r-values of 0.55 to 0.82. But trabecular thickness at MDCT showed no significant correlation to HR-pQCT-derived numbers.
"Trabecular thickness is highly overestimated at MDCT, most likely due to partial-volume effects," Issever said. The highest correlations were found in bone volume fraction measurements, and correlations for trabecular spacing were moderate.
"When we compare 64- to 320-slice CT, both scanner types equally well depict trabecular bone," she said. "Whether we use the standard protocol or the high-dose protocol, they perform equally well and there is no big difference between them.... At the distal site of the radius we do get higher correlations to HR-pQCT."
In situ assessment possible with MDCT
Although it is certainly helpful to understand MDCT's capabilities with regard to evaluating the structure of bone from the distal radius, noninvasive assessment of the spine would be a far more compelling and practical solution for patients, Issever said when introducing her second study at the March 10 ECR osteoporosis session.
"The main costs of osteoporosis in morbidity and mortality are at the sacral sites such as the spine and the femur -- and that's where we need to go," she said. But the challenges of evaluating these central sites are formidable.
"We have soft-tissue-dependent constraints of spatial resolution, image quality, beam hardening -- it's just very hard to do accurate direct depiction of central sites because it's difficult to get there," she said.
Two previous studies have looked at spinal MDCT for bone-structure assessment; "however, these studies lacked a direct comparison between an in vivo or in situ trabecular structure analysis and a gold standard of reference, and this is the gap we wanted to close in our study," Issever said.
This study scanned the lumbar spines (L1-L3) of 45 unfixed cadavers approximately five days postmortem. Bone mineral density (BMD) was computed using QCT, 64-detctor-row MDCT, and a micro-CT (μCT) scanner, a high-resolution modality typically used to examine small animals, fat, and bone.
MDCT imaging was performed on 45 lumbar vertebral bodies with an average in-plane pixel size of 0.274 mm2 and a slice thickness of 0.500 mm. Then the bone core was extracted and formalin-fixed for later analysis by μCT, performed with nominal isotropic resolution of 16 μm.
The μCT dataset was matched to the MDCT dataset by rescanning the vertebral body with the sample removed, and then rescanning using HR-pQCT. Anatomic landmarks were then used to match the MDCT and μCT data, Issever explained.
The analysis compared standard structural measures including bone volume fraction, trabecular thickness, trabecular number, trabecular separation, connectivity, and structure model index. In addition, MDCT-derived texture measures, Minkowski functionals, and scaling index method (SIM)-based measures were included.
According to the results, MDCT-derived structure measures obtained in osteoporotic spines showed only limited correlations to the trabecular bone structure. However, MDCT-derived density measures showed highly significant correlations to the trabecular bone density.
|
||||||||||||||||||||
| MDCT-derived structure measures of osteoporotic spines showed only limited correlations to the trabecular bone structure (BV/TV) and trabecular thickness (Tb.Th.). However, MDCT density measures were well correlated to trabecular bone density (vBMD). |
"MDCT highly overestimates trabecular thickness, but what's more interesting is the correlation between μCT and MDCT," Issever said. "What we find again is that [bone-mineral] density-based measures such as vBMD or BV/TV show higher correlations with μCT. Trabecular thickness shows moderate correlations ... we believe due to partial-volume effect."
Both QCT- and MDCT-derived density measures showed the highest correlations with micro-finite-element models for stiffness and elastic modulus (R2 = 0.58-0.66, p < 0.001).
"When we look at μCT values we find good correlation for density, but in total we have to say that μCT measures are not capable of improving correlations compared to QCT," Issever said.
The last test was a stepwise regression analysis performed by entering the structure/density measures into the equation in an effort to incorporate texture measures.
"With texture measures for vBMD values and for BV/TV, [MDCT was] above the level of QCT," she said. Thus, combining MDCT with MDCT-derived texture measures improved (R2 = 0.76, p < 0.0001) the predictive strength substantially better than structure measures.
"BMD plus texture and structure plus texture have higher correlations than BMD and texture measures alone," Issever concluded. "And MDCT-derived structural measures in the spine show limited correlations compared to μCT."
Responding to a question from the audience, Issever said substantial additional research would be needed before routine in-vivo assessment of bone strength was clinically feasible, particularly in the spine where most osteoporosis-related problems occur.
"For distal sites [e.g., the radius] it is within reach," Issever said. "But the difficulty is when we want to put it in a clinical setting. Unlike bone mineral density measurements where "we have normal values that we can use, and T-squares that we can correlate to, these kinds of measures are missing with trabecular bone.... Without a normative reference database, to put it in the clinic is still a long way off," she said.
By Eric Barnes
AuntMinnie.com staff writer
April 6, 2009
Related Reading
More evidence for atherosclerosis and bone loss link, February 18, 2009
Musculoskeletal deficits associated with pediatric Crohn's, January 29, 2009
Flat-panel CT finds early signs of bone damage in anorexics, December 9, 2008
Skinny teens warned about osteoporosis risk, February 2, 2007
BMD recovery after anorexia based on weight gain and menstrual function, August 23, 2006
Copyright © 2009 AuntMinnie.com