How accurate is coronary CT angiography (CCTA) compared to invasive quantitative coronary angiography (QCA)? Results for the two modalities correlate fairly well for most lesions, but when it comes to stenosis measurement, quantitative CCTA of the stenosis area correlates more closely with QCA compared to diameter stenosis measurement, according to researchers from Poland.
Dr. Maciej Krupinski, from the radiology department at Krakow's John Paul II Hospital, found that most differences fell within a half a percentage point when area measurements were used, four times as close as diameter measurement -- although the results varied by plaque type. But the results are important because differences in stenosis measurement could potentially affect treatment decisions in patients with coronary heart disease.
"To date most studies evaluated the diagnostic value of coronary CT angiography to detect significant diameter coronary artery stenoses, but there is a paucity of data comparing CCTA to invasive coronary angiography for area stenosis assessment," Krupinski said in a presentation at the 2012 European Congress of Radiology (ECR). "The aim of this study was to compare the variance of quantitative area and diameter stenosis measurement in significant obstructive coronary artery lesions between CCTA and invasive coronary angiography."
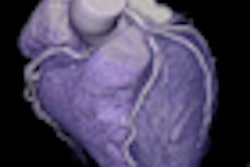
 Significant coronary stenosis of left anterior descending branch is shown in the same patient, a 53-year-old man, using CCTA (above) and invasive coronary angiography (below). Images courtesy of Dr. Maciej Krupinski.
Krupinski, along with Dr. Bartosz Laskowicz and colleagues, analyzed the results of the two modalities in 50 patients (16 women, 34 men, average age 60.5 years) with significant coronary artery stenoses (≥ 70% stenosis) using a dual-source CT scanner (SOMATOM Definition, Siemens Healthcare).
Both CCTA and quantitative CT angiography (CTA) were performed using standard techniques, and all patients underwent invasive angiography within three months of their CT scans. After reconstruction all images were quantitatively analyzed using a dedicated workstation. Area and diameter stenosis were measured at the minimal and reference measurement points, and vessels smaller than 1.5-mm were excluded from analysis.
Plaques were characterized as noncalcified, mixed-composition, or calcified. Most measurements were automated, but in the case of calcified plaque, manual measurements were performed and a B46F kernel was used. For noncalcified and mixed plaques, the group relied on automated quantification.
"Quantitative CTA area of stenosis was counted as the ratio of the minimal lumen area at this site of the maximum stenosis and the mean value of the proximal and distal reference measurements, and the diameter stenosis was measured on the same map," Krupinski explained. Then the minimal and reference measurements in invasive coronary angiography were established manually in the projection showing the most severe narrowing and calculated as a mean value, and the area diameter measurements were performed using the same measurement methods as for quantitative CCTA."
 Two graphs that illustrate underestimation of stenosis by CTCA. Above: graph shows Bland-Altmann analysis of QCTA area stenosis compared with QCA for all evaluated (A), noncalcified (B), mixed (C), and calcified (D) lesions. Below: graph shows Bland-Altmann analysis of QCTA diameter stenosis compared with QCA for all evaluated (A), noncalcified (B), mixed (C), and calcified (D) lesions. Graphs courtesy of Dr. Maciej Krupinski.
Among the 50 patients, 604 segments were analyzed, 29 of which were not evaluable. Among the remaining 575 (95.2%) segments, 65 revealed significant coronary stenosis was shown in both imaging modalities, including 19 (29.2%) calcified plaques, 17 (26.1%) mixed plaques, and 29 (44.6%) noncalcified plaques. "Bland-Altman analysis revealed a mean difference between quantitative CTA and QCA of 2% for area stenosis and 0.5% for diameter stenosis," he said.
There was very good correlation for all noncalcified and mixed-composition lesions, and no correlation for calcified lesions by either measurement method, he said. As for lesion diameter, correlation between quantitative CCTA and QCA was moderate for all lesions, good for noncalcified and mixed lesions, and once again not correlated for calcified lesions.
Summing up the results, Krupinski said that "the area stenosis closely correlates QCA with quantitative CCTA. This correlation is better for area stenosis measurement than diameter stenosis measurement and is highest in noncalcified and mixed-plaque composition."
Spearman's rank correlation between quantitative CCTA and QCA
|