At 3-tesla, delayed gadolinium-enhanced MRI of cartilage and T2 mapping are feasible in the wrist, despite the thin cartilage, musculoskeletal experts from the University of Heidelberg in Germany have found.
Reduced delayed gadolinium-enhanced MRI of cartilage and increased T2 mapping values in normal-appearing cartilage of patients may indicate early cartilage damage. As with other joints, both methods can detect glycosaminoglycan loss and increased water content in areas of chondromalacia with nonsuperiority of either technique in receiver operating characteristic (ROC) analysis, noted Dr. Christoph Rehnitz and colleagues from the musculoskeletal radiology section in the department of diagnostic and interventional radiology.
"T2 mapping and delayed gadolinium-enhanced MRI of cartilage may be used as an additional tool in difficult cases such as preoperatively before proximal row carpectomy to identify normal cartilage layers or exclude subtle cartilage damage," they stated in an e-poster presented at the 2015 congress of the European Society of Musculoskeletal Radiology (ESSR).
Heidelberg study design
The researchers conducted a study to show the feasibility of delayed gadolinium-enhanced MRI of cartilage and T2 mapping of the wrists in healthy volunteers and in patients with wrist pain. It included establishing the optimal time interval after contrast injection, evaluation of normal values of healthy cartilage, and assessment of values of cartilage damage.
Fifteen healthy volunteers (mean age, 26.0 ± 2.2 years) and 17 patients with wrist pain (mean age, 41.4 ± 13.1 years) were examined using 3-tesla MRI. For delayed gadolinium-enhanced MRI of cartilage, a 3D dual-flip volumetric interpolated breath-hold examination (VIBE) sequence before and after intravenous administration of gadopentetatedimeglumine (0.2 mmol/kg) and for T2 mapping a multi-echo-spin-echo T2-weighted sequence were performed. Delayed gadolinium-enhanced MRI of cartilage sequences were repeated at 15, 30, 45, 60, 75, and 90 minutes after contrast injection in all 15 volunteers.
The optimal time interval was defined as the period of steady state of contrast agent penetrating into, or diffusion out of, the cartilage, i.e., when no further significant differences of T1 values between the time-points were observed.
Rehnitz et al performed region of interest (ROI) analyses in normal-appearing carpal cartilage of all individuals, as well as in areas of chondromalacia in a subgroup of 11 patients with Noyes grade 2-3 cartilage damage indentified in cartilage sensitive proton-density weighted fat-saturated turbo spin-echo or true fast imaging with steady state precession (TrueFISP) images.
Statistical analyses included paired t-tests, Wilcoxon tests, and ROC analyses regarding the ability to differentiate between damaged and normal cartilage. P-values of < 0.05 were considered significant.
All about the image
For image analysis, values for normal cartilage were evaluated in healthy volunteers using ROI analysis in cartilage surfaces of the capitate, lunate, scaphoid, and radius in the color-coded maps of delayed gadolinium-enhanced MRI of cartilage and T2 mapping. Areas of chondromalacia in patients were identified using proton-density weighted fat-saturated images. ROI measurements in the delayed gadolinium-enhanced MRI of cartilage and T2 mapping images comprised the damaged area and were compared with normal cartilage of the other carpal bones, as well as the adjacent nonaffected cartilage of the same bone.
When the authors determined the optimal time point for delayed gadolinium-enhanced MRI of cartilage, the T1 values showed a significant decrease between initial measurement and all 15-minute time-points up to 45 minutes. Between 45 and 90 minutes, the differences were not significant, so the optimal time-interval for delayed gadolinium-enhanced MRI of cartilage measurement was between 45 and 90 minutes after contrast injection. To be definitely within the optimal time interval and a clinically reasonable timeframe, Rehnitz and colleagues chose the 60 minute time point for further measurements.


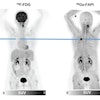
Normal delayed gadolinium-enhanced MRI of cartilage (left) and T2 mapping values (right) in healthy volunteers and normal appearing cartilage of patients. At the optimal time-point 60 minutes after contrast injection (red box-plots), the T1 values in patients were significantly lower (p < 0.013). T2 values in normal appearing cartilage of patients were significantly higher compared with healthy volunteers` cartilage of the wrist.
As shown in the figure, normal delayed gadolinium-enhanced MRI of cartilage values for healthy appearing cartilage in volunteers were at t = 60 min 731.3 (mean) +/- 47.1 ms and significantly lower in patients (mean 674.6 +/-72.1 ms, p = 0.01). Normal T2 values were 36.5 +/- 5.5 in volunteers and significantly higher (mean 41.1 +/- 3.2 ms, p = 0.009) in patients. Areas of chondromalacia showed lower delayed gadolinium-enhanced MRI of cartilage values (mean 551 +/-84 ms, p < 0.001) and higher T2 values (mean 63.9 +/-17.7, p = 0.001) when compared with normal appearing cartilage.
Areas under the curve (AUCs) of delayed gadolinium-enhanced MRI of cartilage were 0.91, and for T2 mapping were 0.99. Comparisons of the AUCs yielded nonsignificant differences of T2 mapping and delayed gadolinium-enhanced MRI of cartilage (p = 0.17).
The optimal time interval for delayed gadolinium-enhanced MRI of cartilage was calculated using the course of delayed gadolinium-enhanced MRI of cartilage T1 values (exact 25% and 75% percentile) after contrast injection in the healthy volunteers. The T1 values showed a significant decrease between initial measurement and all 15-minute time-points until 45 minutes. The optimal time interval started at the first nonsignificant T1 decrease between 45 and 60 min (p = 0.661) after contrast injection and lasts until the end of the observed period.
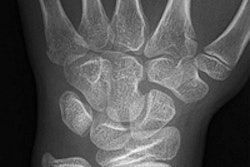
For imaging of chondromalacia, the Heidelberg team identified cartilage thinning in the TrueFISP sequence in a patient with scapholunate advanced collapse in the wrist. The damaged cartilage showed decreased values in the delayed gadolinium-enhanced MRI scan, which is indicative of loss of glycosaminoglycans and increased values in T2 mapping indicative of increased water content and disturbance of the collagen network.