When it comes to standard MR attenuation correction (AC) for whole-body PET/MRI oncology scans, Danish researchers are advising users to account for bone attenuation to eliminate bias in tracer uptake of bony and soft-tissue lesions.
The corrections in accuracy and reliability are necessary to make PET/MRI a "routine imaging modality" for the detection of lesions and in follow-up examinations of patients with lesions anywhere in the body.
Lead author of the study, published online in the European Journal of Radiology is Marianne Aznar, PhD, associate professor in the department of oncology at Rigshospitalet in Copenhagen (EJR, 1 April 2014).
Over the last decade, PET/CT has become the modality of choice for the diagnostic workup of oncology patients, with CT as the vehicle for attenuation and scatter correction.
Most recently, PET/MRI has garnered more interest from oncologists and related specialists as an alternative to PET/CT due to MRI's ability to enhance soft-tissue contrast and negate radiation exposure from CT scans.
"One of the key challenges of simultaneous PET/MRI is the need to perform attenuation and scatter correction using the available MRI and emission information only," Anzar and colleagues wrote. "Of note, this approach does not account for the presence of bone in the attenuation map. The absence of bone, however, could lead to a noticeable overall and local underestimation of the attenuation correction factors and, therefore, to a bias of the AC PET data."
So, the purpose of the study was to evaluate the efficacy of MR-based attenuation correction on the accuracy and detection of PET-positive lesions in oncology patients undergoing integrated PET/MRI, and to compare it with PET/CT.
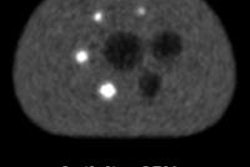
Researchers enrolled 20 clinical oncology patients who were referred for PET/CT scans. Half of the patients with soft-tissue lesions in the head and neck region were scheduled for FDG-PET/CT scans, while the other half with osseous lesions were scheduled for whole-body sodium fluoride (NaF)-PET/CT exams.
Patients in the first group received 306 MBq (± 80 MBq) of FDG, with PET/CT (Biograph TruePoint/mCT, Siemens Healthcare) beginning 62 minutes (± 4 minutes) after injection. Subjects in the second grump received 203 MBq (± 21 MBq) of NaF, with PET/CT starting 49 minutes (± 5 minutes) after injection.
Following the PET/CT exam, participants underwent PET/MRI in an integrated scanner (Biograph mMR, Siemens). The scans began 117 minutes (± 27 minutes) after FDG injection or 130 minutes (± 32 minutes) after NaF administration.
Researchers then used MR-based attenuation correction to adjust PET data, as well as attenuation maps from coregistered CT data from the PET/CT scans.
Attenuation maps were created for each patient through the coregistration of CT images to the MR-based attenuation correction images, adding CT bone values representing cortical bone (cortCT), spongiosa bone (spongCT), average CT value (meanCT), and original CT values.
The relative differences of the PET images after attenuation correction using the modified attenuation maps were compared, and mean standardized uptake values (SUVmean) were calculated in anatomical reference regions and for PET-positive lesions.
Significant variations
In the FDG group, all positive lesions were visible across the different PET images, as well as significant variations of lesion uptake across the study cohort. The differences in SUVmean between MR-based attenuation correction and original CT values ranged from 0.0% to -22.5% (median difference of -7.2%).
Researchers noted in cases of more extreme difference in SUVmean, "[o]ne cannot exclude that a potential bias as high as 22% might cause a small positive lesion to be undetected."
There were fewer differences in SUVmean in the cerebellum (an average of -14%, ranging from -17% to -8%) between MR-based attenuation correction and original CT values.
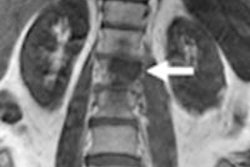
The upper spine was most affected by variations in attenuation with a relative difference in SUVmean of -27% across all FDG patients (range from -40% to -8%). The relative difference between MR-based attenuation correction and cortCT was even greater (165%) in the upper spine.
Among the NaF group, relative differences of SUVmean of the lesions were strongly affected by the different attenuation correction maps. The maximum relative difference ranged from -22.4% with MR-based attenuation correction to 111% with cortCT.
The least affected area was the bladder, with an average bias of 2% for SUVmean between MR-based attenuation correction and original CT values.
"Our results suggest that an accurate representation of the bones is needed to assure the quantitative accuracy of PET/MRI data," Anzar and colleagues wrote. "In the absence of bone attenuation factors, the accuracy of the quantification of bone lesions, as well as soft-tissue lesions relatively close to the bone, is inaccurate."
The researchers cited as a limitation of the study that the study protocol used is sensitive to coregistration and segmentation errors, due to positioning differences between the CT and PET/MRI scans. "However," they added, "on visual examination, patient position was very reproducible between PET/CT and PET/MR and, thus, residual misalignment was not considered to be a major source of error."