An experimental software tool that combines the analytical power of coronary CT angiography (CTA) and MR perfusion images of the heart can provide a comprehensive assessment of coronary artery patency and cardiac function that is superior to examining both separately, according to a new study in the International Journal of Computer Assisted Radiology and Surgery.
The technique was particularly useful in patients with more than one stenosis, allowing clinicians to pinpoint the source of flow obstructions, and providing more accurate diagnoses in selected patients with multivessel disease, according to the Dutch researchers.
"When using the SMARTVis [Synchronized Multimodal Heart Visualization] tool, a more reliable estimation of the correlation between perfusion deficits and stenoses led to a more accurate diagnosis, as well as a better interobserver diagnosis agreement, which demonstrates the reproducibility of the results obtained with the SMARTVis tool," wrote lead investigator Hortense Kirişli, PhD, from Erasmus Medical Center in Rotterdam, the Netherlands, as well as Vikas Gupta and colleagues from Leiden University Medical Center in Leiden and colleagues from Delft (Int J CARS, online first, 24 September 2011).
Development of the visualization and analysis tool was done using MeVisLab (Mevis Medical Solutions), a rapid prototyping platform designed for medical image processing and visualization. Automated stenosis detection, computation of patient-specific coronary perfusion territory maps, and cylindrical parameterization, were developed in C++. Python or JavaScript were used to add dynamic functionalities to the graphic user interface (GUI).
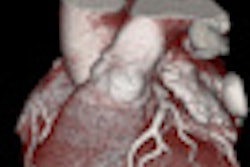
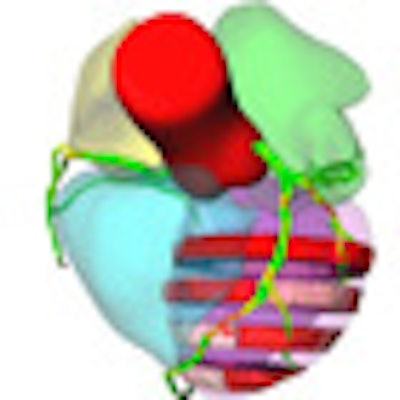
![Comprehensive visualizations proposed in the SMARTVis tool. Left: 3D model of the heart and coronary artery tree extracted from coronary CTA; arteries are color-coded with the degree of stenosis. Also, patient-specific perfusion territories are shown on the left ventricle (left anterior descending [LAD] in red, left circumflex [LCX] in blue, marginal obtuse [MO] in yellow, and right coronary artery [RCA] in green). Right: 3D model of the heart with perfusion information integrated. All images courtesy of Hortense Kirişli, PhD.](https://img.auntminnieeurope.com/files/base/smg/all/image/2011/10/ame.2011_10_18_12_19_37_523_2011_10_19_SMARTVis_fig2top.png?auto=format%2Ccompress&dpr=2&fit=max&q=70&w=700) Comprehensive visualizations proposed in the SMARTVis tool. Left: 3D model of the heart and coronary artery tree extracted from coronary CTA; arteries are color-coded with the degree of stenosis. Also, patient-specific perfusion territories are shown on the left ventricle (left anterior descending [LAD] in red, left circumflex [LCX] in blue, marginal obtuse [MO] in yellow, and right coronary artery [RCA] in green). Right: 3D model of the heart with perfusion information integrated. All images courtesy of Hortense Kirişli, PhD.
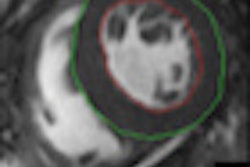
Comprehensive visualizations proposed in the SMARTVis tool. Left: 3D model of the heart and coronary artery tree extracted from coronary CTA; arteries are color-coded with the degree of stenosis. Also, patient-specific perfusion territories are shown on the left ventricle (left anterior descending [LAD] in red, left circumflex [LCX] in blue, marginal obtuse [MO] in yellow, and right coronary artery [RCA] in green). Right: 3D model of the heart with perfusion information integrated. All images courtesy of Hortense Kirişli, PhD. Left: 2D perfusion bull's-eye plot (BEP) with coronary tree projected on top; the more transparent the artery, the further it is from the epicardium. Right: 2D perfusion BEP with coronary tree and coronary perfusion territories projected on top; arteries are color-coded with the degree of stenosis. The spheres next to the 2D BEP indicate the position of connection with the right ventricle.
Melding different data sources
Assessing coronary artery disease requires a two-step approach; both CT and MRI do their respective jobs better than alternative methods, and the extent and severity of coronary stenosis can be assessed with coronary CTA, while the presence and extent of ischemia is accurately depicted using perfusion MR, the authors wrote.
Experts use several assumptions to determine which stenoses are associated with which ischemic regions. However, enormous variability in the coronary artery anatomy of different patients, and the uncertain relationship between perfusion regions and the arteries that supply them, make patient-specific systems necessary to sort them all out, particularly in cases of multivessel disease.
"Integrating information in a patient-specific way is mainly beneficial in the diagnosis of intermediate-risk patients, who have suspected stenoses in two of the three main coronary arteries, as there may be ambiguous assignment of perfusion defects and culprit coronary arteries," Kirişli stated. Without automated integration of the two modalities, the reader must "mentally integrate anatomic and functional information," the authors noted.
They presented their patient-specific visualization system known as SMARTVis, a software tool for relating coronary stenoses and perfusion deficits derived from coronary CTA and MR perfusion studies, respectively. The system performs 2D or 3D fusion of anatomical and functional information, automated detection and ranking of coronary artery stenosis, and estimation of patient-specific coronary perfusion territories.
Using the results from image processing stage, the system presents complex visualizations for relating coronary stenoses to specific perfusion defect regions, using the following steps:
- Project coronary artery tree onto a 2D bull's-eye plot (BEP)
- Integrate perfusion information into a 3D model of the heart
- Automatically detect and rank coronary stenoses
- Estimate patient-specific coronary perfusion territories
- Synchronize the 2D and 3D viewers with coronary CTA and perfusion MR images.
SMARTVis represents the first tool known to the authors to integrate all three elements into a visual analysis tool, thus maximizing the complementary diagnostic capabilities of the two modalities.
"In the present work, two novel visualizations are provided: 1) The introduction of a 3D volumetric BEP, which preserves the volumetric nature of the left ventricular wall and thus allows better appreciation of transmurality information, and 2) the overlay of coronary arteries on the epicardial surface of the 3D volumetric BEP, providing additional contextual information," Kirişli and colleagues wrote.
The system focuses on model-based visualization techniques to combine coronary CTA and perfusion MR data. Within this structure, the researchers incorporate several previously developed visualization techniques, including projection of the coronary tree onto the 2D BEP, integration of functional information into a 3D model, a coronary perfusion territory map, linked multiple views, and animation.
Overcoming limitations encountered by previous groups, they were able to reconstruct and project the coronary artery tree using absolute diameter to analyze the impact of coronary artery stenoses on myocardial perfusion directly from MR perfusion images instead of a simulated model, the group stated.
Case-study clinical evaluation was used to investigate whether integration of coronary anatomy and myocardial perfusion can improve risk-assessment, diagnosis, and management of patients with coronary artery disease.
The study pitted conventional analysis versus SMARTVis in four patients with multivessel disease. The patients were selected from a cohort of 50 symptomatic patients with suspected coronary artery disease (Kirschbaum et al) that compared adenosine MR perfusion with invasive fractional flow reserve (FFR) testing.
Coronary CTA images were acquired on a dual-source CT scanner (Somatom Definition, Siemens Healthcare) using tube voltage of 120 kV and ECG pulsing. Perfusion MR images were acquired using a 1.5-tesla MRI scanner (Signa CV/i, GE Healthcare), using an eight-element phased-array receiver coil placed over the thorax. Cine cardiac perfusion MR was performed with a steady-state free precession technique (FIESTA).
The CT and MR images were analyzed separately by two expert readers. Then, anatomical information extracted from the CT data were combined with functional MR images. Finally "comprehensive visualization techniques were used to facilitate the joint analysis of coronary stenoses and myocardial perfusion defect," the authors wrote.
 On ICA, suspected stenoses (30%) were visually detected in the three main arteries (LAD, LCX, and RCA). Based on the FFR measurement, only the stenoses in the LAD and RCA were significant (FFR LAD = 0:75, FFR RCA = 0:73) while the stenosis in the LCX was not considered to be significant (FFR LCX = 0:94). During the analysis, reader one assigned a perfusion defect in the apical inferior and inferoseptal wall to the RCA (resp. LAD) and in the inferolateral wall to the LCX (resp. RCA) using the conventional (resp. SMARTVis) tool. This patient has a right-dominant system, thus the RCA is feeding a larger area. In that case also, the coronary overlay and perfusion territory map helped him to correct his diagnosis. Similarly, reader two misclassified the perfusion defect in the inferoseptal wall to the RCA, missing the significant stenosis in the LAD with the conventional tool, but reaching a correct diagnosis using the SMARTVis tool.
Image analysis
In the conventional analysis, readers used axial and multiplanar reconstructed (MPR) views to list the positions and degree of significant stenosis in each affected vessel. Then rest/stress perfusion images were analyzed with the readers asked to list all suspected ischemic regions. Then they combined the information mentally to assign the specific stenosis to specific ischemic territories and make decisions about revascularization.
During the conventional analysis of one patient, reader one assigned a perfusion defect in the apical slice to the RCA instead of the LAD and a midanterior defect to the LCX instead of the LAD, but the SMARTVis tool corrected the errors. Reader one changed his diagnosis in all four cases, and reader two in one case, the authors wrote.
Importantly, the researchers found no variability between the diagnosis of both observers using the software tool, whereas during the conventional evaluation, the readers disagreed on one or two vessels in every patient.
"All the diagnoses were correct after using the SMARTVis tool, except for one case," they wrote. "The diagnosis of [patient one] remained incorrect, owing to overestimation of the degree of stenosis or overestimation of the number of abnormal perfusion regions during the analysis by the observers."
The computation time for the centerline extraction was about three minutes for each of the three main arteries (LAD, RCA, LCX) and about 1.5 minutes for each side branch. The CTA processing can be performed within 20 to 30 minutes, depending on the number of coronary arteries processed, they wrote.
Less interobserver variability using SMARTVis tool
Subjective evaluation determined that 49% of the images were very accurately segmented (less than 1 mm error) and that 29% were accurately segmented (error between 1 and 3 mm), underscoring the robustness of the method, the authors wrote.
|
||||||||||||||||||||||||||||||||||||
"When using the SMARTVis tool, a more reliable estimation of the correlation between perfusion deficits and stenoses led to a more accurate diagnosis, as well as a better interobserver diagnosis agreement, which demonstrates the reproducibility of the results obtained with the SMARTVis tool," Kirişli and colleagues concluded. "Thus, systems that integrate coronary anatomy and myocardial perfusion information may provide new opportunities for the risk assessment, diagnosis, and management of patients with [coronary artery disease]."
The tool would not be expected to improve diagnosis in low-risk patients, inasmuch as only one culprit artery can be assigned to the perfusion defect, the authors noted. And triple-vessel disease patients are likely to be referred for immediate vascularization. Still, the SMARTVis tool is suitable for visual analysis of patients in all disease states because it can integrate anatomical and functional information in a single display.
"To what extent this would facilitate the diagnosis for these cases remains to be investigated; nevertheless, visualizations derived from the SMARTVis tool can be included in the patient report, to provide a quick overview of the patient's disease state," they wrote.