Textural variables derived from PET images reveal intratumor heterogeneity and may help predict a patient's response to chemotherapy. Researchers explored their associations with the clinical responses of breast cancer patients in a recent article published in Physics in Medicine and Biology.
Virtually all cancers exhibit intratumor heterogeneity, a characteristic that plays an important role in tumor growth and may also contribute to treatment failure. Quantifying this heterogeneity could enable prediction and monitoring of a tumor's response to treatment. With this aim, a research team has studied a range of textural variables derived from PET images, and explored their associations with clinical response to chemotherapy in breast cancer patients (Phys Med Biol, 21 January 2013, Vol.58:2, pp. 187-204).
The researchers from Imperial College London and King's College London analyzed PET images using the tracer F-18 fluorothymidine (FLT), uptake of which is correlated with cell proliferation in breast cancer. They employed texture analysis to assess the heterogeneity of cell proliferation in individual tumors and explored potential associations between textural variables and clinical response to chemotherapy.
"PET is a powerful molecular imaging modality that can be used to study many processes that are specific to tumor biology," explained Julien M.Y. Willaime, a doctoral candidate at Imperial's Comprehensive Cancer Imaging Centre. "Chemotherapy agents primarily target proliferating cells. Our aim was to assess whether heterogeneous FLT-PET uptake in tumor volumes -- an indirect measure of proliferation -- can be reliably quantified using textural metrics. And if so, whether this information could potentially be used to discriminate between patient groups."
Tissue variability
Willaime and colleagues examined FLT-PET images from 15 breast cancer patients. All patients underwent one scan prior to the start of chemotherapy and one week into treatment, and some had an additional pretreatment validation scan. PET images were reconstructed using the OSEM iterative method, an algorithm for image reconstruction in nuclear medical imaging, and compared with filtered back-projection (FBP) reconstructed images.
The researchers calculated 28 textural variables for each FLT-PET image. Five were derived from the intensity distribution of radiotracer uptake, to measure intratumor uptake variability. The remaining variables described the spatial organization of radiotracer uptake. Standardized uptake values (SUV) were also determined 60 minutes after radiotracer injection.
 Range of standardized uptake values (SUVmean) and coefficient of variation (CV) values in healthy breast, liver, metastasis, node, tumor, and vertebra. Source for all charts: Julien M.Y. Willaime.
The team first studied differences in textural variable values across tissue types. Mean radiotracer uptake (SUVmean) was lowest in normal breast, medium in tumors and nodes, and highest in the liver and vertebra. The values of two intensity-based features -- the coefficient of variation (CV) and EntropyFOS, a measure of information content, suggested that uptake of FLT in healthy breast tissues was characterized by the predominance of a group of voxels with similar intensity, but different from the mean intensity. Only slight variations in spatial textural features were observed across tissue types.
Predictive ability
For five of the patients who had two FLT-PET scans prior to therapy, the researchers used an intraclass correlation coefficient (ICC) to assess the repeatability of textural feature measurements. An ICC of 0.7 or above indicates that intrapatient variability is reasonably small compared to interpatient variability, and suggests that the feature could potentially be used to study associations with treatment outcome.
To explore such associations, they selected a subset of eight textural features that had ICC of 0.7 or above and the same intrapatient variability range (below ± 30%) as SUV measurements. These features were: CV, entropyFOS, AUC-CSH, contrastGLCM, dissimilarity, homogeneity, contrastNGTDM,and complexity.
They then tested associations between these features (as measured on pretreatment PET scans) and clinical response to chemotherapy at 60 days. Potential correlations were evaluated in 11 patients: six responders and five nonresponders.
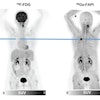
 Example of FLT uptake in tumor of responding (a) and nonresponding (b) patients. Averaged activity distribution profiles in the primary lesion of responder and nonresponder patients, using OSEM reconstruction (c).
Intensity histograms of FLT uptake (at baseline) were positively skewed, with a greater average shift in the intensity distribution seen for nonresponding patients than responders. Better separation of the groups was achieved when using OSEM rather than FBP to reconstruct the images.
Values of CV and (for certain normalization parameters) complexity were statistically greater in lesions of nonresponders. Conversely, AUC-CSH and entropyFOS values were greater in lesions of responders. SUVmean at baseline was also greater, although not statistically significant, in lesions of responders versus nonresponders.
The researchers surmised this technique could help inform the likelihood of response to neoadjuvant chemotherapy before treatment starts. They note that observed differences in radiotracer distribution between the two groups at baseline may be due to the presence of fewer highly proliferative tumor cells in lesions of nonresponders than responders.
Response monitoring
Willaime and colleagues also examined changes between baseline and one week after the start of therapy. They saw that a number of textural features were altered following chemotherapy, and suggest these should be evaluated for clinical relevance in larger clinical trials.
 Dot plots representing percentage change in CV and homogeneity values at one week after the start of therapy for responder (R) and nonresponder (NR) patients.
For example, true increases in CV and homogeneity were seen for four of six responder patients after one week of therapy. No changes in these features were noted for the other two responders. A true decrease in CV was seen for one nonresponder patient and no changes for the others. No true changes in homogeneitywere observed for any of the nonresponders.
Willaime noted it may potentially be possible to combine results from more than one textural variable to increase the technique's predictive power. "Some of the features might provide complementary information and enhance the discriminatory power. We are now combining intensity and spatial features and are planning to extend the technique to bigger sample sizes," he told medicalphysicsweb.
© IOP Publishing Limited. Republished with permission from medicalphysicsweb, a community website covering fundamental research and emerging technologies in medical imaging and radiation therapy.