A multitasking algorithm designed to analyze CT lung cancer screening images and pick out likely malignancies, nodule volumes, as well as other characteristics at CT, delivers significant, if modest, performance improvements over that based on size alone, concludes a report in the International Journal of Computer Assisted Radiology and Surgery.
The lung nodule analysis scheme incorporated several 3D image features to determine the malignancy status of 736 nodules from two, large, lung cancer screening trials. The results showed a slight improvement in malignancy prediction compared with that of size alone in a variety of nodule sizes. A features-based assessment also improved discrimination of similar-sized nodules.
"Our results indicate that there is a measurable improvement in the prediction of malignancy by using image features over size alone; however, the main predictor is size and this must be carefully accounted for when attributing the benefit of other image features," wrote lead author Dr. Anthony Reeves, PhD, professor of electrical and computer engineering at Cornell University, Ithaca, NY (IJCARS, 30 June 2015).
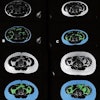
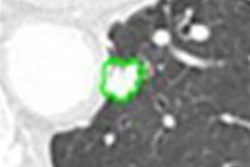
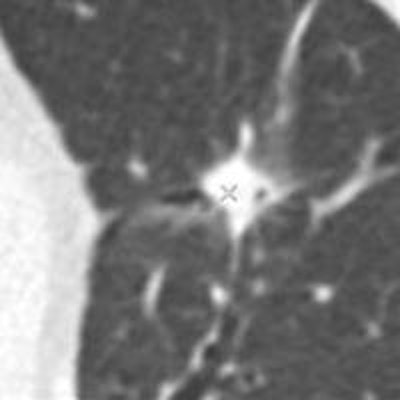
 Are these nodules malignant or benign? The algorithm was confident for predicting the top-row lesions (correct responses) and the first lesion (left side) in the bottom row, but not confident for the last two lesions in the bottom row (middle, right). Results are anecdotal because the outcome depends on system operating point. (Answers left to right, top row followed by bottom row: malignant, benign, malignant, benign, malignant). All images courtesy of Dr. Anthony Reeves.
The results showed only modest improvements versus size-based classification, but the work breaks new ground by taking the single most important predictor of malignancy by taking size out of the equation to focus on features alone.
"Previous studies [results as high as ~ 0.9 AUC] have overestimated the patient-specific benefit of malignancy diagnosis by not considering the class size imbalance in the image test set," he told AuntMinnieEurope.com. Previous studies rely on benign nodules being significantly smaller than malignant nodules, and they typically avoid the large numbers of benign nodules that are present in screening.
Size-balancing methods, including size-balanced evaluation, training, and size binning offer a more informative analysis in this study.
Answering the key question
For indeterminate nodules at CT, many expensive, risky, and time-consuming follow-up procedures could be avoided if nodule analysis were improved, wrote Reeves and colleagues Yiting Xie, PhD, and Artit Jirapatnakul, PhD.
"Current lung cancer screening practice is to identify pulmonary nodules on annual lowâ€dose CT scans and to apply a followâ€up procedure, such as another CT scan or a fine needle biopsy, to suspicious nodules to determine their malignancy status," they noted. "We consider here how that malignancy status may be determined from just the initial CT image."
Nodule size is the single most important determinant of malignancy or benignity, of course. This study was limited to nodules with at least three consecutive CT slices and a minimum size of 3 mm3 for volumetric analysis.
Lung cancer screening studies aim to detect malignancies as early as possible at the lowest possible dose, resulting in high image noise that confounds classification schemes.
"In this paper, we explore image features other than size in order to provide an improved probability estimate," the authors wrote. "Since size is easily determined, the main question of interest is what is the probability of cancer at a given size rather than what is the probability of cancer with respect to distribution of sizes."
Distribution is the largest factor driving the performance evaluation of datasets of different distributions, the group hypothesized, testing it in two ways: first by using a size-based classifier that uses only nodule size to determine malignancy, and by creating a classifier that uses datasets of balanced nodule size distributions.
Based on known outcomes, the study determined the best-performing classifiers, focusing on geometric rather than textural features to minimize the distractions of noise.
All CT scans had a slice thickness ranging from 1.0 mm to 2.5 mm thick, with bone and standard reconstruction kernels. Nodules ranged from 3 mm to 30 mm in diameter, and had to span three slices, preferably four.
The balanced dataset was created to assess the impact of size on the classification result, consisting of 163 benign and 163 malignant nodules 5 mm3 to 14 mm3.
Forty-six 3D features were computed from the nodules and classified into morphological, density, surface curvature, and margin gradient categories.
The feature classification used five different classifiers: distance-weighted k-nearest neighbor classifier (dwNN), a support vector machine (SVM) classifier with a polynomial kernel (SVM-P), SVM with a radial basis function kernel (SVM-R), the logistic regression classifier (LOG), and the size threshold classifier (SIZE-C), as shown in the tables below. Outcomes were represented at the area under the average ROC curve and the ROC curve obtained after cross-validation with five ROC curves.
Tests
The first test evaluated the impact of class-size distribution balance by comparing the size-only classifier with methods using the other image features. The second evaluated the impact of using size-balanced datasets -- emphasizing features for discrimination.
Rather than using conventional AUC, the incremental increase in AUC compared with a size classifier (IAUC) was used for the evaluation as it was thought to be more relevant.
| Classifier performance for unbalanced datasets | |||||
| Training data | Size-C | dwNN | SVM-P | SVM-R | LOG |
| AUC | 0.725 | 0.750 | 0.772 | 0.772 | 0.761 |
| IAUC | 0.025 (p = 0.09) | 0.047 (p = 0.001) | 0.047 (p = 0.001) | 0.036 (p = 0.15) | |
The size classifier (Size-C) provides an AUC of 0.725 for the combined dataset. The number would have been larger had the authors included small benign nodules typical of screening studies.
Below shows the classifier performance (AUC and IAUC) for the balance dataset trained on balanced and unbalanced data. Each classifier was also compared to the size classifier (see p values).
| Classifier performance for balance dataset | |||||
| Training | Size-C | dwNN | SVM-P | SVM-R | LOG |
| Unbalanced AUC | 0.510 | 0.584 | 0.639 | 0.642 | 0.564 |
| Unbalanced IAUC | 0.074 | 0.129 (p = 0.01) | 0.132 | 0.054 (p = 0.11) | |
| Balanced AUC | 0.510 | 0.700 | 0.708 | 0.699 | 0.624 |
| Balanced IAUC | 0.190 (p = 0.001) | 0.198 (p = 0.001) | 0.189 (p = 0.001) | 0.115 (p = 0.003) | |
Pulmonary nodule classification from screening CT images acquired for nodule detection is a very challenging task, according to the authors.
"The moderate (0.74 AUC) achieved in this study suggests that, while confident diagnosis is unlikely to be accomplished by this method alone, the information obtained may be useful in follow-up decisions," Reeves wrote. "In sharp contrast, growth rate from multiple CT images shows much greater promise for determining the malignancy status of pulmonary nodules, but that method requires CT imaging follow-up."
The holy grail is to develop a system that after detecting a nodule in the CT image, the computer will inform the user whether it is benign or malignant from the image data, eliminating the need for costly follow-up, he added.
The state of the art won't accomplish this task right now, "However, there is some information from the nodule appearance that may be used to help select the best follow-up procedure. In current screening protocols, for solid nodules, the main follow-up decision factor used from the CT image is nodule size."
Screening CT data will likely remain of poor quality, "However, there is some hope for the distant future that 'smart' CT scanners may one day identify suspicious nodules and record high-resolution images of these nodules during a single session," he wrote. The algorithm will certainly be improved as well.
"The critical area for improvement is to have more image data to train and evaluate the computer system," Reeves wrote. The use of thin-section CT data also would allow evaluation of more image features and machine learning strategies.