Native T1 mapping may be the year's hottest cardiac imaging technique, but it can't do something it's expected to do: distinguish healthy from diseased myocardium. That's the key finding by researchers from Essen University Hospital in Germany.
The group looked at more than 200 cardiac imaging patients who had undergone imaging tests, identifying three-fourths of a heart patient cohort with diffuse myocardial pathologies and one-fourth with healthy myocardium. Re-examining them with T1-mapping sequences, they found they could not distinguish the healthy from the diseased myocardium patients by T1-mapping levels.
"Although the calculation of the average native myocardial T1 relaxation time may be helpful to distinguish between certain groups of patients with different cardiac pathologies, our study shows that overall, the native myocardial T1 value fails to discriminate between healthy and diffuse diseased myocardium in individual cases," wrote Dr. Juliane Goebel and colleagues from the department of interventional radiology and neuroradiology (PLOS One, 24 May 2016).
Uncertainty surrounds T1 levels
T1 mapping enables quantitative assessment of the myocardium, but its value in clinical routine remains unclear, Goebel and colleagues wrote. Native T1 relaxation times are considered to be a genuine tissue property, one that can be altered by changes of extracellular space and interstitium as well as cardiomyocytes. Thus, T1 values can be used to detect both focal and diffuse cardiac pathologies. Native T1 values trend higher when extracellular space is increased, as in edema, diffuse fibrosis or focal scarring, or when there is interstitial amyloid deposition. T1 tends to be lower when there is iron accumulation or intracellular fat deposition as in Anderson-Fabry disease.
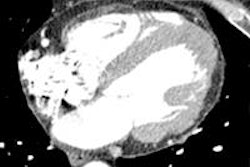
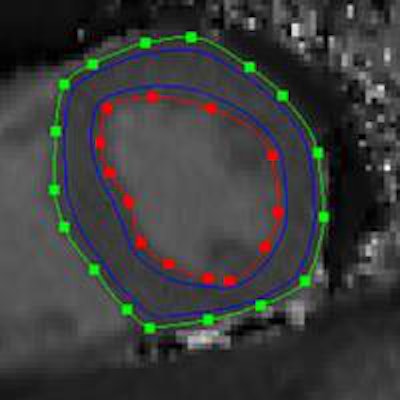
 Midventricular short axis native T1 map. Endocardial (red line) and epicardial (green line) contours, as well as the region of interest for the calculation of the average myocardial T1 value (area between the blue lines) can be seen. Republished with permission of PLOS One.
"Accordingly, changes in the native T1 value have been described in various cardiac diseases, and to some extent, the reported mean T1 values allowed for a differentiation between distinct patient groups," the authors wrote. "However, it remains unclear whether the average native myocardial T1 value is a reasonable discriminator between healthy and diffuse diseased myocardium (e.g., myocarditis, HCM [hypertrophic cardiomyopathy], DCM [dilated cardiomyopathy]) in individual cases."
This study examined whether average native myocardial T1 values allow for differentiation between healthy and diffuse diseased myocardium in individual patients.
The investigators performed native T1 mapping in 204 participants, including 54 with healthy hearts and in 150 patients with diffuse myocardial pathologies, such as 76 with coronary artery disease, 19 with acute myocarditis, 26 with convalescent myocarditis, 12 with hypertrophic cardiomyopathy, and 17 with dilated cardiomyopathy.
They excluded 155 patients who did not clearly fit into a single category, or had a combination of pathologies based on medical history, electrocardiogram (ECG), lab tests, invasive angiography, cardiac CT, or cardiac MR excluding T1-mapping information.
MRI was performed using a 1.5-tesla scanner (Magnetom Avanto, Siemens Healthcare) at a single midventricular short-axis slice using modified Look-Locker inversion recovery (MOLLI) sequence (TR 2.63 msec, TE 1.12 msec, eight different TIs ranging from 120 to 4,103 msec, matrix 256 x 144, field-of-view 360 x 306 mm2, flip angle 35°). The average native T1 value was measured in each patient using dedicated software. The modified MOLLI sequence consisted of one inversion pulse with T1 sampling performed over five acquisition heartbeats and three recovery heartbeats, then a second inversion pulse followed by three acquisition heartbeats, the team wrote.
The modified MOLLI sequence shortens the sequence significantly and renders it less heart rate-dependent, the team wrote.
Average native myocardial T1 values were measured using investigational T1 mapping software (Siemens Healthcare), calculating both the range of observed T1 values for each patient group and comparing them via a t-test. Receiver operating characteristic (ROC) analysis was used to gauge the ability of T1 mapping to differentiate between healthy and diseased myocardium. Two experienced cardiologists read the results.
Differences only between groups
The results showed significant differences between T1 levels among patient groups. For example, the mean T1 value of the "healthy hearts" group differed significantly from that of the dilated cardiomyopathy group (p < 0.001), hypertrophic cardiomyopathy (p = 0.035), and acute myocarditis (p = 0.044).
However, there was no significant difference between the "healthy hearts" (955 ± 34 msec) and coronary artery disease (951 ± 37 msec, p = 0.453) groups, or patients with convalescent myocarditis (965 ± 40 msec, p = 0.240). T1 values were lower overall for healthy hearts, but there was broad overlap of T1 values over all groups.
"The higher mean native myocardial T1 value in the DCM and HCM group can be explained by an increased interstitial space in DCM and HCM due to diffuse myocardial fibroses," Goebel and colleagues wrote.
| Broad range of Average T1 values within patient groups | |||
| Group | Low (msec) | High (msec) | Mean (msec) |
| Healthy hearts | 838 | 1,018 | 955 ± 34 msec |
| DCM | 882 | 1,034 | 992 ± 37 msec |
| HCM | 897 | 1,042 | 980 ± 44 msec |
| Acute myocarditis | 925 | 1,025 | 974 ± 36 msec |
| Convalescent myocarditis | 890 | 1,071 | 965 ± 40 msec |
ROC analysis showed the average native T1 value does not allow for differentiating between healthy and diffuse diseased myocardium, except for the subgroup of DCM.
Six cases were considered outliers, but excluding them did not lead to any relevant changes in the statistical results between those with healthy hearts and DCM, acute myocarditis, convalescent myocarditis, or coronary artery disease.
"A significant interindividual variance of the average native T1 values was observed in all analyzed groups, as well as a substantial overlap between the observed groups," the study team noted.
An attempt to differentiate healthy hearts from diseased hearts using the average native myocardial T1 value as a discriminator by ROC analysis showed an area under the curve (AUC) of 0.552 (p = 0.233) for joint analysis of all diffuse diseased hearts in an AUC of 0.563 (p = 0.221) for CAD, AUC of 0.644 (p = 0.072) for acute myocarditis, AUC of 0.584 (p = 0.240) for convalescent myocarditis, AUC of 0.688 (p = 0.067) for HCM, and AUC of 0.814 (p < 0.001) for DCM. Only for DCM was the AUC substantially different from 0.5.
Stipulating a specificity of 87% for the diagnosis of DCM, the native T1 cut-off value was more than 988 msec and the sensitivity was only 70.6%, the group wrote.
As for limitations, T1 mapping was performed only for one midventricular short axis slice, and the measured average native myocardial T1 value in this slice may not completely represent the entire left ventricular myocardium, the authors wrote. This is probably not important other than in pathologies that diffusely affect the entire left ventricular myocardium.
"Although the calculation of the average native myocardial T1 relaxation time may be helpful to distinguish between certain groups of patients with different cardiac pathologies, our study shows that overall the native myocardial T1 value fails to discriminate between healthy and diffuse diseased myocardium in individual cases," the authors concluded. "Our ROC analysis showed that only in case of DCM the native myocardial T1 relaxation time allows distinguishing healthy and diffuse diseased myocardium, and even in this case the sensitivity is comparably low."