Dutch researchers are using a breast density mapping software package to predict which density patterns are associated with higher rates of tumors found between mammography screenings. The results, presented at RSNA 2015, may help make supplemental breast cancer screening exams like MRI or ultrasound more effective and cost-efficient for select patients.
The team from Radboud University Medical Center in Nijmegen examined 87 women with interval breast cancers and 10 times as many controls, aiming to predict which breast density patterns would maximize sensitivity for predicting interval cancers in women undergoing annual screening mammography.
Their calculations with density maps revealed two novel predictors of higher cancer rates that performed better than commonly used measures such as percentage of dense breast tissue for predicting interval cancer risk.
"Percentage dense volume (PDV) performs reasonably well," but significantly lower than two novel measures of breast density used in the study, said Katharina Holland, in a presentation at the Chicago meeting. Holland, who led the study, is a PhD student at the university.
More cancers seen in dense breasts
"The sensitivity of mammography is impaired in high-density breasts," she said. "Women with dense breasts have an increased risk for developing breast cancer and also an increased risk for interval cancers -- cancers detected outside of the screening program. Women with extremely dense breasts have more than six times the risk for developing interval cancers."
About a third of all breast cancers are interval cancers, and there are many reasons why such lesions might be missed. Sometimes the radiologist will miss a small, fast-growing tumor, or a tumor might be seen and misinterpreted as benign. Or it might be hidden by dense breast tissues, Holland said.
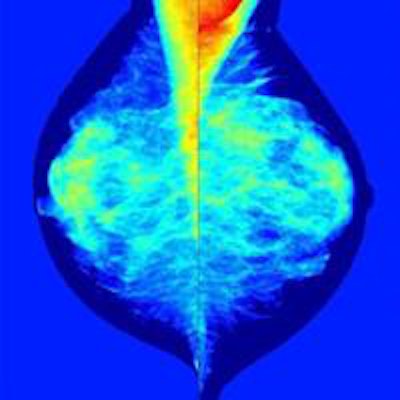
 Images show mammography images processed with density-mapping software (Volpara), using the output of the dense area classifier. Top, original density map in grayscale; middle, density maps on the color scale; bottom, thresholded density map showing dense areas larger than 1 cm. All images courtesy of Katharina Holland.
"To reduce the number of interval cancers we might think about additional breast cancer screening, so depending on the risk of developing breast cancer we might like to offer the woman supplemental screening with ultrasound or MRI," she noted. "The purpose of our study was to investigate methods to identify women whose dense breasts are associated with an increased risk of developing breast cancer."
How many get extra screening
But supplemental screening requires resources, and places additional burdens on patients, so it's important to minimize the number of women undergoing supplemental screening while maximizing the yield of detected cancers, Holland said.
Breast density mapping software is enabling more nuanced calculations of breast density measurements in terms of predicting which breast density patterns are more likely to be associated with interval cancers. The Nijmegen researchers hope to use this information to optimize the selection of women for supplemental screening with MRI or ultrasound.
Interval cancers and controls
The study, performed as part of the ASSURE Project for personalized breast cancer screening, examined the last negative screening mammograms of 87 women who later presented with an interval cancer, along with 870 randomly selected normal screening exams used as controls.
Software by New Zealand-based Volpara "provides tissue volume and dense tissue volume for each pixel location," she said. "The most recent version also provided us with a density map. For each pixel, we know the amount of glandular tissue in volume and centimeters."
The software also details the feature distribution of screen-detected cancers via a histogram, she said. "From that we derived the correlative distribution function, so we can see, for example at a threshold of 15 mm, that 67% of all screen-detected cancers [in the cohort] are smaller than 13 mm."
Holland and her team used the density maps to compute four masking measures, including:
- Volume of glandular tissue (VGT)
- Percent dense volume (PDV)
- Percent area where dense tissue exceeds 1 cm (PA1)
- Possibility that a tumor exists with diameter t, at a location with dense tissue thickness d, normalized to the breast area, and taking into account the size distribution of screen detected cancers (PT)
The investigators also determined the percentage dense area (PDA) after classifying pixels automatically in dense and nondense classes using a random forest classifier, Holland said.
They calculated the cases with the highest-masking measure by thresholding for each method, computing the fraction of interval cancers as a function of selected controls. Finally, they calculated the ratio between interval cancers in patients who had been offered supplemental screening, as well as the supplemental screening rate.
Large dense areas and cancer probability rated high
The results showed that two novel measures of breast density, PA1 and PT, were the most predictive of interval cancers, achieving a sensitivity of almost 20% at a screening rate of 5%, Holland said. For screening rates higher than 20%, the best prediction of interval cancers can be seen when using PA1 and PT for stratification.
"PVD percentage dense volume performs reasonably well, but significantly lower than ... PA1 and PT," Holland said. Both dense area larger than 1 cm and PT performed best."
 Results show that two novel measures of breast density provided the highest sensitivity for detecting interval cancers, at rates approaching 20%.
"We showed that different breast density measurements are suitable for stratification," Holland said. "However, a careful choice of stratification criteria is necessary depending on the number of women for whom one is willing to offer supplemental screening. Novel masking risk measures have a higher sensitivity than often used measures such as percent dense volume and percent area."
How does high risk in the result translate into a personalized decision for supplemental screening? More research will be needed to answer that question, she said.