Computer-aided detection (CAD) software can make it easier for radiologists to interpret complicated prostate MRI studies using multiple pulse sequences, Italian researchers reported in a session at ECR 2014 in Vienna.
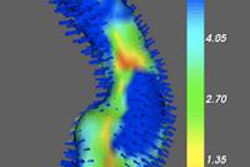
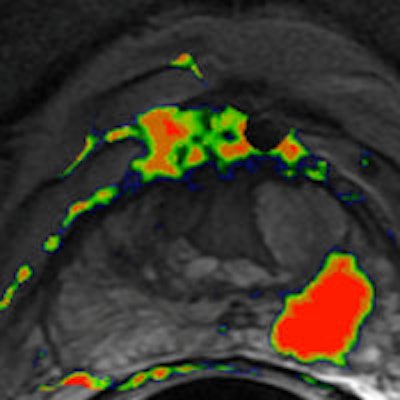
A group from the Institute for Cancer Research and Treatment in Candiolo, Italy, developed a CAD algorithm that incorporates morphological and functional information from multiparametric MRI, which uses multiple pulse sequences to provide a color-coded map depicting a per-pixel estimate of cancer probability. In testing, the system yielded very good sensitivity and specificity results.
"[The CAD system] increases objectivity and reproducibility of prostate MRI interpretation, also speeding up the reporting process," said presenter Dr. Daniele Regge.
Complementary information
Multiparametric MRI integrates T2-weighted images, T1-weighted images, diffusion-weighted imaging (DWI), and dynamic contrast-enhanced MRI (DCE-MRI) to provide complementary information for improving the preoperative detection and local staging of cancer. But these complicated studies can be a challenge for radiologists to handle, Regge said.
"The problem from a clinical point of view with multiparametric MRI is that you have different information coming from different sequences, and you have to put T1 and T2 and especially diffusion-weighted and dynamic-contrast enhanced MRI ... together in one big puzzle," he said. "Each sequence has different information, and it's difficult for the radiologists to interpret all of this information."
As a result, the group sought to develop a CAD algorithm that combines morphological and functional parameters to calculate a voxelwise malignancy probability map. The goal is to increase the objectivity and reproducibility of prostate MRI interpretation, as well as to provide automatic localization of areas within the gland that are suspicious of cancer, Regge said.
The researchers developed the algorithm using data from 30 patients who had prostate-specific antigen (PSA) levels greater than 4 ng/mL and prostate cancer confirmed via transrectal ultrasound biopsy. The patients, who had a mean age of 65 ± 8 years, underwent 1.5-tesla multiparametric MRI exams using an endorectal coil followed by radical prostatectomy within three months of imaging.
Of the tumors, two had Gleason scores of 6 (3+3), 22 had scores of 7 (3+4), six had scores of 7 (4+3), one had a score of 8 (4+4), and one had a score of 9 (4+5). The median tumor volume was 1.6 cc.
Pathologists contoured foci of cancer with ink on specimen slices, and the radiologists compared MRI findings with pathological findings. These results were used to develop a reference standard to train and test the CAD algorithm, Regge said.
The CAD algorithm was then developed. The system's CAD processing pipeline begins by performing image registration of DCE and DWI images with T2-weighted images. Next, image features such as quantitative parameters and semiquantitative parameters from DCE-MRI were extracted, followed by the addition of apparent diffusion coefficient (ADC) values from the diffusion-weighted images and T2 signal intensity from T2-weighted images.
','dvPres', 'clsTopBtn', 'true' );" >
From the initial 16-dimension feature vector, the team performed receiver operating characteristic (ROC) analysis to determine if there was too much correlation among any of the features. This allowed the developers to whittle down the CAD feature vector to six features: maximum uptake, wash-in, plasma volume fraction (Vp), rpun, T2 signal intensity, and ADC value, he said.
These parameters were fed into a support vector machine (SVM) classifier, which generated a percentage probability of cancer for each pixel of the prostate. The probabilities were displayed on a parametric color-coded map on the image. The CAD system yielded a mean area under the curve of 87%, sensitivity of 82%, and specificity of 83%.
Next, the researchers developed a software interface for displaying the results, as well as tools to measure, for example, time intensity curves, he said. Tools were also added to report the findings and plot the tumors on an anatomical scheme.
"One of the things we're working on now is to develop and use this CAD system to support MRI-guided biopsies," he said. "So we're planning our biopsies by introducing these probability maps in our software."
While the registration step performed in the software improves the comparison of images from different MR sequences, the CAD system also supports the user by providing a voxelwise malignancy probability map that combines morphological (T2-weighted) and functional (DCE and DWI) information, Regge concluded. It also decreases reader variability and lowers reading time, he said.